Time-Series & Spatial Analytics
at Speed, at Scale

Powerful Tools to Analyze Objects
that Move through Space and Time.
Points and Shapes are native geospatial objects in Kinetica and can be expressed as WKT. Tracks are another native geospatial object type that can be generated from sequential data to represent the paths objects take as they move.
Over 130 OGC high-performance geospatial functions are available with SQL or using the REST API. Functions include tools to filter, compare or aggregate data by area, by track, or custom shape.
Questions you can answer easily with Kinetica...

Alerts when objects dwell or loiter.
What objects pass through an area?

When two tracks come close
Moving tracks passing through changing areas
High Performance on Time-Series and Spatial Joins

Work with Time-Series Data with Ease
Window Functions in Kinetica allow you to apply aggregate and ranking functions over a period of time, and keep the picture updated as data evolves. --
Kinetica's ASOF joins allow you to join data from multiple tables when the timestamps don't exactly match. This makes it easier to understand what's happening even when there aren't exact matches on timestamps from the two tables.
Blog: ASOF joins in Kinetica »
Server-side Visualizations
One of the core challenges with displaying spatial information is moving data from the database layer to the visualization layer. Serializing and moving millions to billions of objects from one technology to another takes time.
Kinetica is able to solve this bottleneck by generating geospatial tiles directly on the server through a Web Mapping Service (WMS). WMS tiles can be used as overlays on top of a map with applications such as ESRI and Mapbox, Leaflet and others.
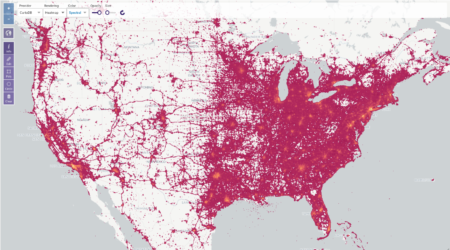
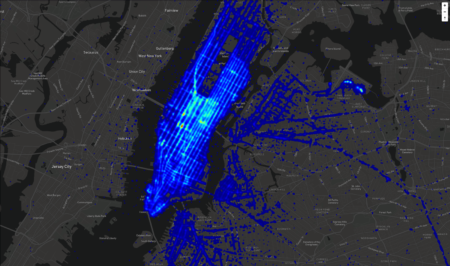
Billions of Points...
Display unlimited points on a map with interactice query. While noisy, this provides a unique means to explore volumes of data that is not possible when generated by the front-end alone.
Heatmaps...
Heatmaps take the noise out of large datasets to show patterns and nodes of maximum usage. Hatmaps generated in-database are another efficient.
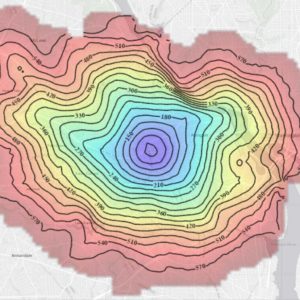
Isochrones...
Isolines represent curves of equal cost, with cost often referring to the time or distance from a starting point. Isochrones work with Kinetica's Graph functionality to visualize distances.
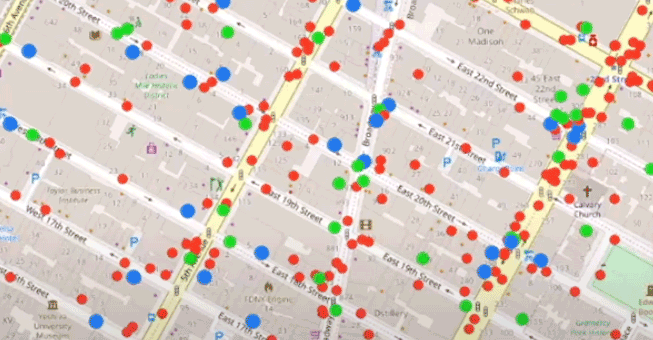
Class Break...
A class break rendering enables you to take data from one or more tables and apply styling on a per-class basis.
Leverage graphs for optimal routes or for network planning
Kinetica's graph API enables you to model spatial data as graphs. Then solve difficult questions using SQL queries, or with in-built graph solvers. Outputs from solvers can be piped directly to maps.

Property Queries
Solvers
Map Matching
Connect to your choice of tools
Kinetica plays well with a wide variety of BI and GIS tools. Or you can work with data through Kinetica Workbench and Kinetica Reveal.
BI & Observability Tools
With Kinetica's implementation of the Postgres Wireline protocol, popular observability and BI tools including Grafana, Prometheus, Datadog, Lookr and others can monitor and integrate directly with Kinetica.
Posgtres Wireline »ESRI ArcGIS
Data in Kinetica can be made available to ArcGIS Insights through ArcGIS JDBC connector and through the ArcGIS Python API, and visualizations passed back through WMS tiles. This enables ArcGIS to be used with streaming location data at scale.
ESRI Integration »Tableau
Kinetica's native extension for Tableau allows for geospatial processing to be done in-database with visulizations delivered back to Tableau through the WMS endpoint.
Tableau Connector »
Custom Applications
Kinetica's REST API with language specific implementations for Python, Javascript, Java, C++, C# and others enable flexible integration with custom applications and including ESRIs ArcGIS tools.
REST API »Kinetica Reveal - Native BI Framework
Kinetica comes with Reveal — a web-based BI framework that makes it quick and easy to start exploring geospatial data. Reveal also connects with Kinetica's geospatial pipeline for advanced mapping and interactive location-based analytics.
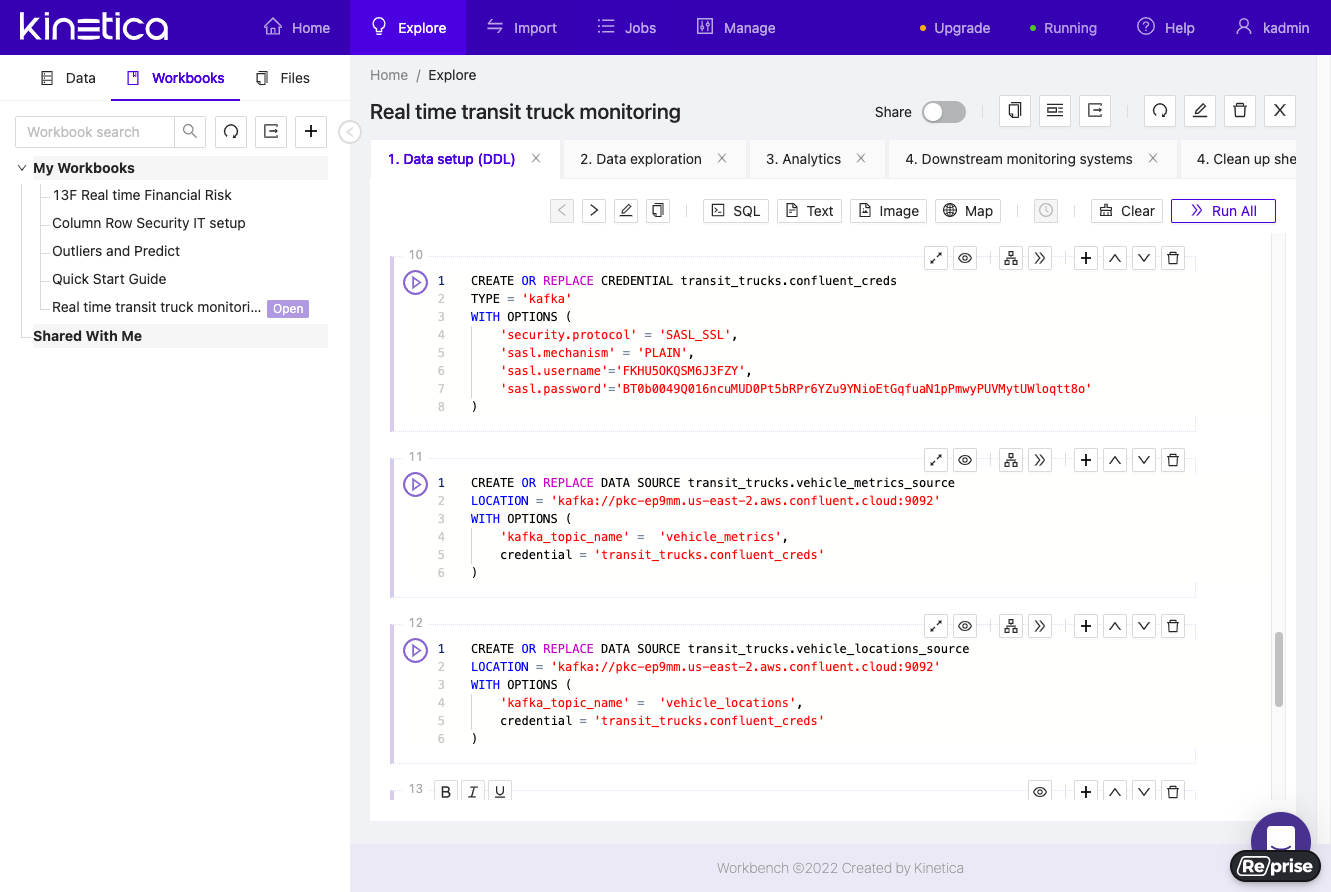
Kinetica Workbench
Kinetica Workbench is a sophisticated, yet intuitive interface, to interactively explore data, organize and store SQL workbooks, import and export data streams, and for general database administration.
Build Real-time Location Applications on Massive Datasets