ArcGIS + Kinetica for Big Spatial Data Analysis
ESRI ArcGIS is a proven solution for advanced analysis and visualization of geospatial data. The application has been the de-facto standard for spatial analysis for decades. Key product strengths include layer management, a flexible user interface, and an extensive library of geospatial functions.
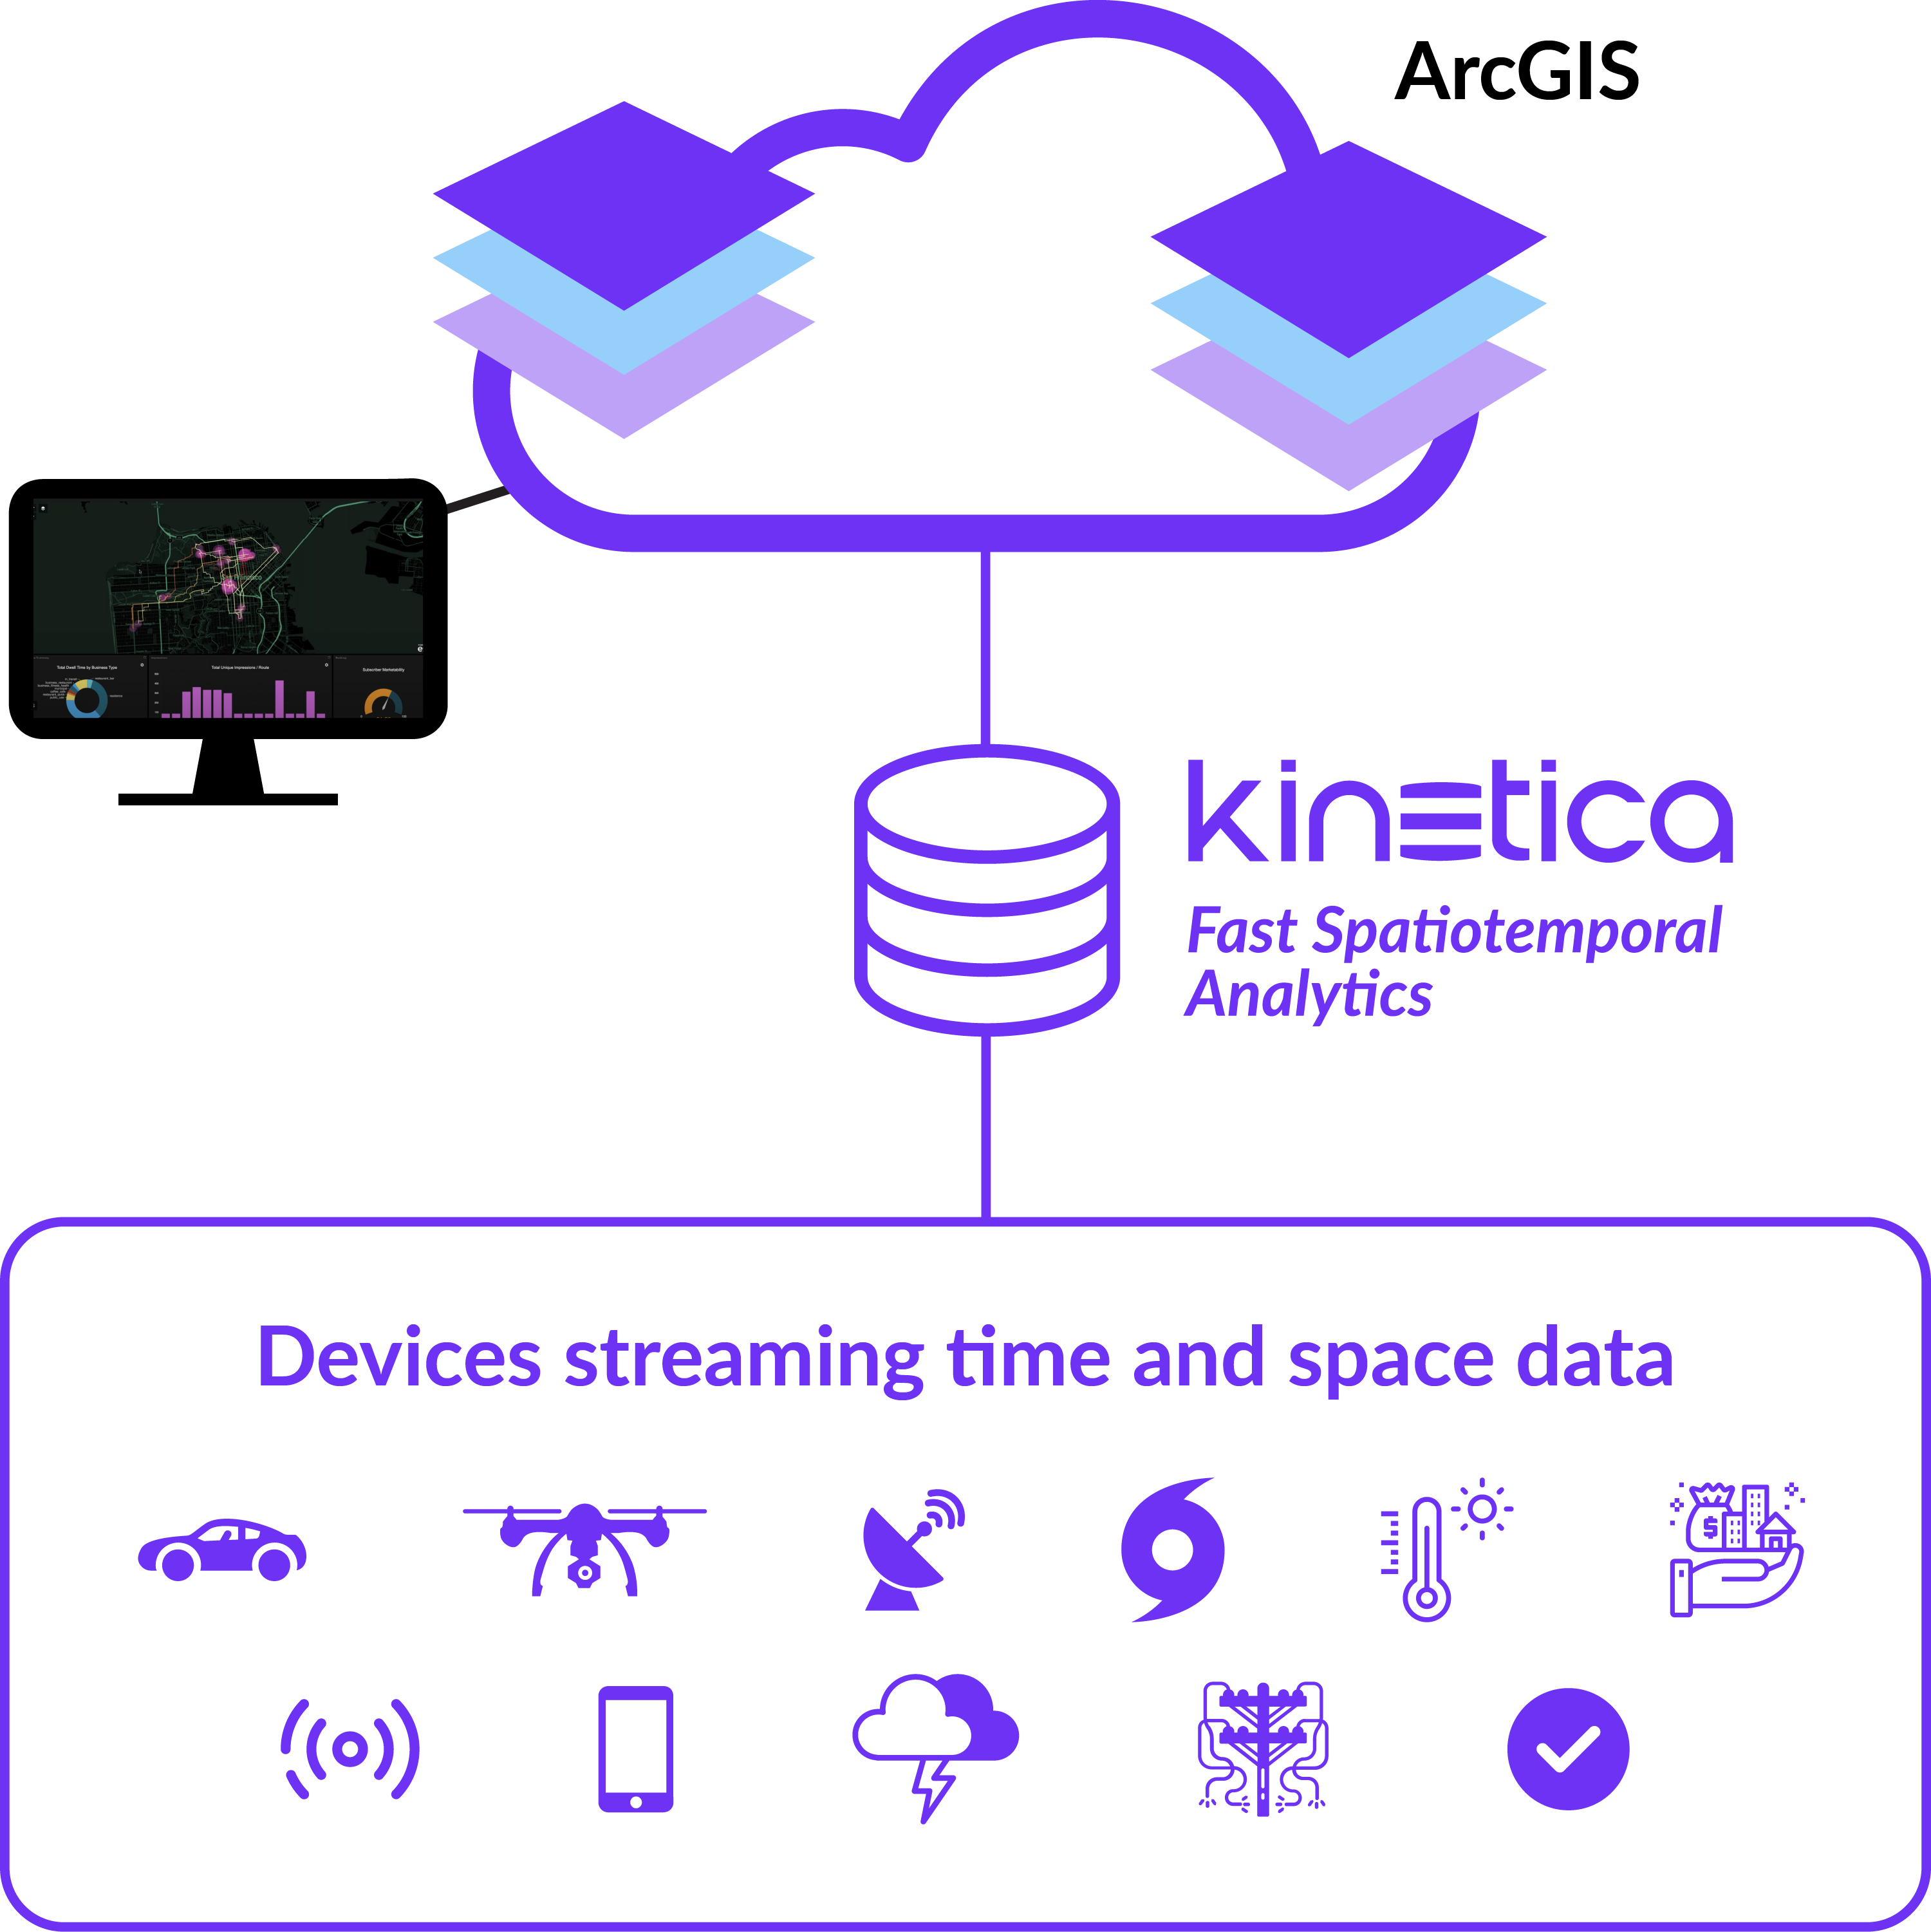
As geospatial datasets evolve as a result of IoT devices capable of sharing their location over time, geospatial data management and analysis is undergoing a period of big data disruption. Early attempts to integrate ArcGIS with distributed analytic databases have had limited success because the underlying analytic databases such as Spark, Snowflake, Oracle and others, were never designed to support the complexity of large scale geospatial queries, real-time nature of location enriched IoT data, or the rendering of high fidelity data points on a map. Ultimately, the first attempts to do big spatial data analysis were limited, and incurred excessive data engineering and compute costs.

Organizations like the FAA, Ford, Liberty Mutual, T-Mobile and others are running the largest and most complex spatial and time-series use cases on Kinetica. Kinetica’s design center is based on handling modern spatio-temporal workloads on massive (billions of rows) and streaming data sets. Key product strengths include:
- Extensive support for geo-joins like contain, within-a-distance, intersect, overlap, and more
- Advanced geospatial analytic functions like st_*, stxy_*, entity tracks, and more
- Graph matching and solving
- Native Kafka integration and distributed ingest for real-time processing
- Web Mapping Service (WMS) and Vector Tile Support for server side rendering of heatmaps, contours, tracks, unique value, and classbreaks on billions of records
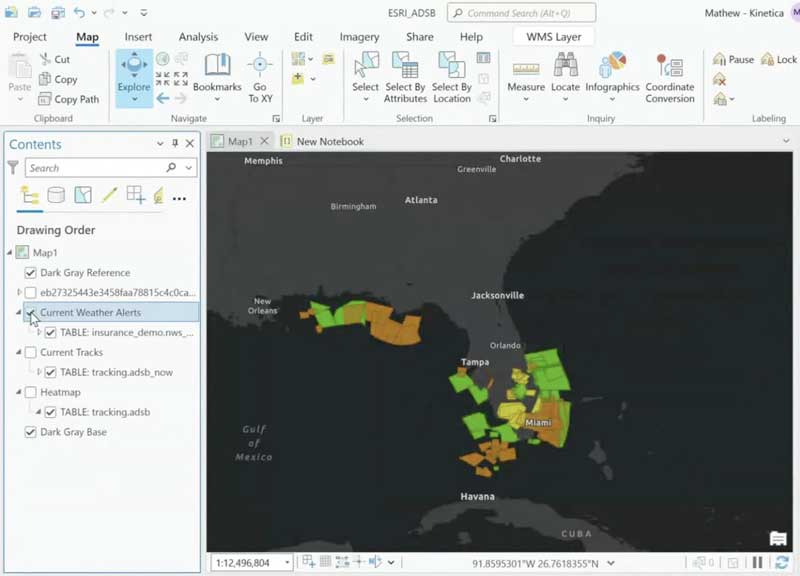
The power of Kinetica in combination with ArcGIS can be seen in this demonstration using data from cellphone signals.
With the launch of 7.1.8, Kinetica now integrates easier with ArcGIS to bring together these complementary technologies to modernize IoT workloads. Data in Kinetica can be made available to ArcGIS Insights through ArcGIS JDBC connector and through the ArcGIS Python API. Users can then use ArcGIS Insights as a visual analytics environment with all the relevant functionality necessary to process, analyze, and display spatial data precisely and accurately. Kinetica can rapidly generate WMS (Web Mapping Service) layers that are passed to ArcGIS. This makes it possible for ArcGIS to display millions or even billions of points on a map, and update these continually to show changes over time as data streams into Kinetica.

Here’s a demonstration of how to leverage Kinetica and ArcGIS to access multi-billion row datasets, perform analytics, and display the results on the map canvas.
Try it yourself. The snippet below shows how to connect to Kinetica, run a geospatial query and publish that layer into ESRI.
import arcgis,arcpy,gpudb
obj = gpudb.GPUdb(host='http://localhost:9191',disable_auto_discovery=True)
df = obj.execute_sql_and_decode(f'SELECT TRACKID,x,y FROM demo.shipping limit 10000')
myDf = pd.DataFrame.from_dict(df['records'])
# Convert to spatial dataframe
GeoAccessor.from_xy(myDf, 'x', 'y')
gis = GIS(url="https://www.arcgis.com",username="USER",password="PASSWORD")
gis.content.import_data(myDf)
Not a Kinetica user yet? Try Kinetica Developer Edition for free!
Build Real-time Location Applications on Massive Datasets