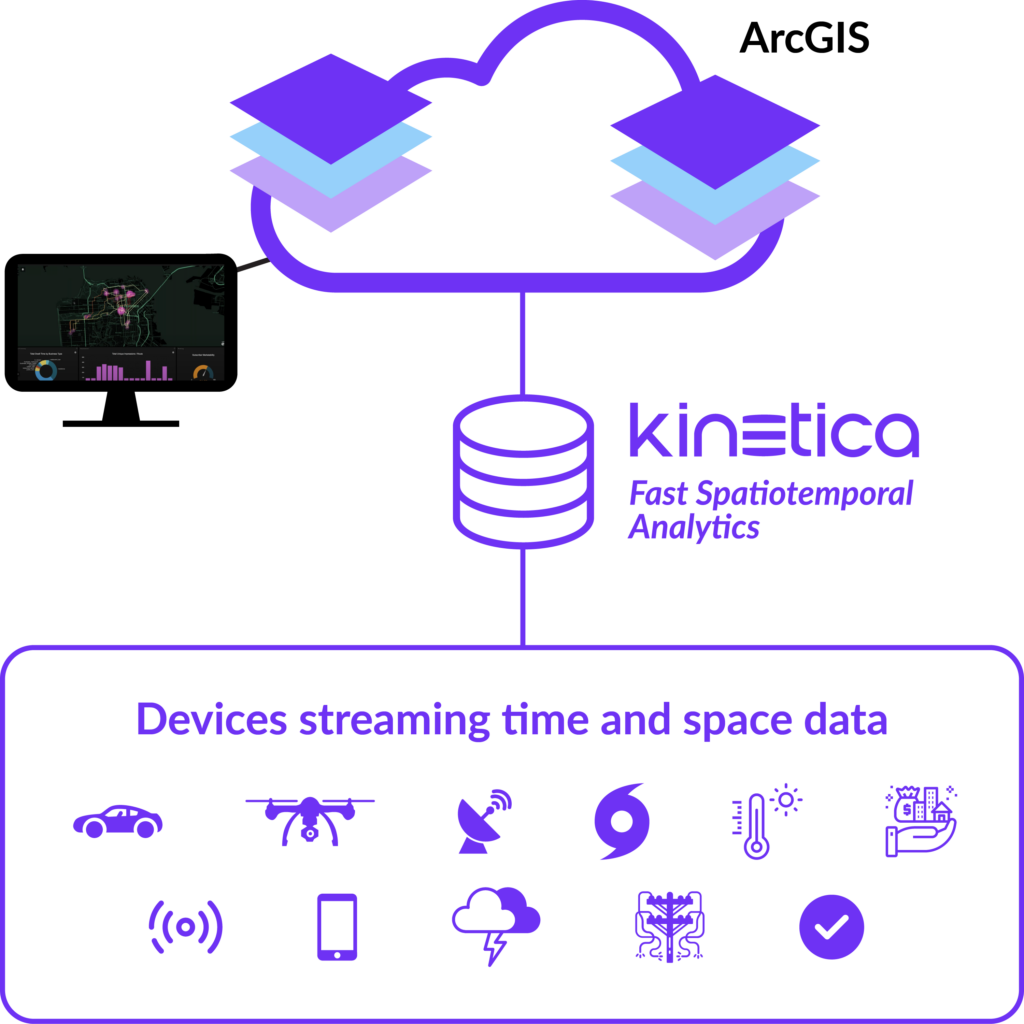
Esri’s ArcGIS is renowned as a robust solution for creating, managing, and analyzing geospatial data. With its comprehensive functionality and impressive capabilities, it has become the platform of choice for organizations that build GIS systems. From establishing spatial relationships to automating assets like utility networks and examining natural phenomena such as wetlands, ArcGIS excels at managing and analyzing static geospatial data types.
However, as the world embraces the era of the Internet of Things (IoT) and data becomes more accessible across time and space, traditional GIS systems like ArcGIS encounter challenges in accessing and managing these voluminous datasets. This is where innovative databases like Kinetica step in.
Kinetica is purpose-built to handle large streaming and historical databases efficiently, while also offering built-in spatial capabilities, making it an ideal solution for geospatial big data challenges. The seamless integration of Kinetica with ArcGIS empowers users to bridge the world of GIS with the immense potential of big data. This marks a significant leap forward for organizations seeking to derive meaningful insights from the vast amounts of data they collect.
Imagine the power of connecting Kinetica with ArcGIS. These two systems come together to handle real-time workloads on massive, streaming datasets without any data aggregation or duplication. By setting it up yourself, you bypass the need for expensive professional services to build a custom solution. Plus, it works seamlessly on both CPU and GPU-based systems.
Once connected, you’ll dive into a comprehensive visual analytics environment within your ArcGIS system. Effortlessly process, analyze, and display spatial data with precision. Kinetica’s unique lightning-fast visualization leverages WMS layers that seamlessly integrate with ArcGIS. Picture the ability to visualize millions, or even billions, of points on a map in real time. These active layers dynamically update to reflect the ever-changing data streams in Kinetica. Enhance your analysis by replaying historical events.
Unleash the potential when Kinetica and ArcGIS join forces. Experience the transformative capabilities of these systems working in harmony.

Renowned organizations like the FAA, Ford, T-Mobile, and others embrace the power of Kinetica to conquer complex spatial and time-series challenges. With its cutting-edge design, Kinetica effortlessly handles massive, streaming data sets, even with billions of records. Let’s dive into its key strengths:
- Extensive support for fast geo-joins like contain, within-a-distance, intersect, overlap, and more
- Advanced geospatial analytic functions like st_*, stxy_*, entity tracks, and more
- Graph matching and solving capabilities
- Native Kafka integration and distributed ingest for real-time processing
- Web Mapping Service (WMS) and Vector Tile Support for server-side rendering of heatmaps, contours, tracks, unique value, and classbreaks on billions of records
The opportunities to bring new insights and value to your organization by combining traditional GIS with spatiotemporal big data services are virtually limitless. These often siloed datasets, together enable data enrichment, analysis, and aggregations.
Below are some examples:
Telecommunication: The vast quantity of spatiotemporal data available to telecommunication organizations can be used to gain valuable insights into customer behavior, network performance, and market trends. By examining where and when customers use their services, these companies can better anticipate demand, tailor offerings to customer needs, and optimize network infrastructure. This utilization of spatiotemporal data can also aid in identifying potential areas of expansion and in strategizing effective marketing campaigns.
Insurance: Tracking extreme events in real-time to allocate resources quicker, and accurately track usage parameters for better rates, faster claim processing, fraud detection, and risk assessment and prediction.
Supply Chain: Demand forecasting requires analyzing large data set across time and location including historical sales data, market trends, and competition to better predict future demand. Data on asset locations, such as warehouses, distribution centers, and retail stores, over time helps optimize logistics, and make real-time decisions to meet changing demands or potential disruptions.
Traffic and Transportation Management: Utilizing spatiotemporal big data enables real-time traffic monitoring, which includes identifying congestion areas and optimizing transportation routes. This helps in effectively optimizing traffic systems, leading to improved efficiency and smoother traffic flow.
Oil & Gas: Combining historical data with live sensor data, petroleum companies are leveraging spatiotemporal analytics for oil exploration, drilling/well analytics, pipeline monitoring and maintenance, supply chain optimization and predictive maintenance of critical assets.
Retail: The retail industry is utilizing spatiotemporal big data to improve operations, enhance the customer experience, and increase sales by analyzing foot traffic patterns, and customer behaviors. Store locations can be optimized, selected, or closed based on complete customer behavior data and deeper demographic trends while optimizing inventory management, and leveraging geolocation-based marketing.
Environmental Monitoring and Analysis: Integrating spatial and temporal data allows scientists and researchers to study environmental factors like air quality, water pollution, climate patterns, and natural disasters, in order to track changes and identify trends.
Smart Cities and Urban Planners: Leveraging spatiotemporal big data, city planners can see population movements by time of day and combine it with land use, weather, energy consumption, and more, allowing them to optimize city resources. As patterns change due to climate change, cities can quickly adjust to ensure livability for their citizens.
Precision Agriculture: The combination of spatial data (e.g., satellite imagery, soil composition maps) and temporal data (e.g., crop growth, weather conditions) quickly enables farmers to optimize irrigation, fertilizer usage, and farming practices, maximizing crop yield while minimizing environmental impact.
Emergency Response and Disaster Management: Integrating spatial and temporal data aids response teams in assessing the severity of disasters, identifying affected areas, and allocating resources swiftly and effectively.
Electric Network Management: With spatiotemporal big data, managing distribution networks becomes more efficient by analyzing consumption patterns, adjusting systems to load changes, identifying potential failures or inefficiencies, and improving reliability.
Public Health Monitoring: Spatiotemporal analysis plays a pivotal role in tracking the spread of infectious diseases, identifying high-risk areas, and strategizing targeted interventions. It equips health organizations to respond promptly and efficiently to outbreaks and epidemics.
These examples give a hint of the tremendous power of integrating spatial and temporal data to unlock valuable insights, facilitate proactive decision-making, and drive progress across various fields.
Let us show you how you can work with your own large datasets in ArcGIS today. Book a Demo

