Skip to content

Modernize Location Intelligence
in the Era of IoT

IoT data is inherently time series, increasingly spatial and sources are expanding rapidly.

Where is the New What

Spatiotemporal data describes where objects are and where they are moving. Prime examples are streams of IoT data from mobile devices, social platforms, static or moving sensors, satellites, wireless, and video feeds from drones and closed-circuit TVs. This data comes in the form of a reading, a timestamp (t), and location coordinates (x & y).
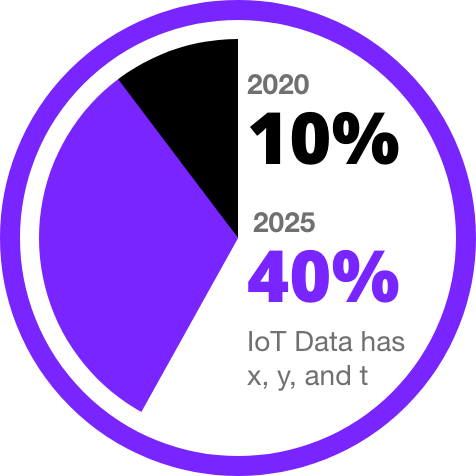
By 2025, projections suggest 40% of connected IoT devices will be capable of sharing their location, up from 10% in 2020
Deloitte, 2021
By 2025, projections suggest 40% of connected IoT devices will be capable of sharing their location, up from 10% in 2020 - Deloitte

Why

Gartner reports the line between IoT-enabled sensors and location tracking is increasingly blurring as providers face increasing demand from clients to address location data along with other sensing information, such as asset status, direction of movement, temperature, and humidity.

These changes in time & space data are driving digital transformation in the areas of Automotive (e.g., connected car), Public Health (e.g., monitoring spread of disease) and Safety (e.g., threat hunting), Security (e.g., common operational picture), Logistics (e.g., fleet monitoring), Environment and Climate (change detection), Retail (e.g., proximity marketing), and many others.

How

Existing databases (even with special object-relational extensions for spatio-temporal data) have struggled to keep up the scale, speed, and specialized analytics required for modern location intelligence workloads.  They were never designed to handle the variety of fusion steps and aggregations in an acceptable latency profile required to power downstream value-added location aware services.

A new paradigm, commonly referred to as vectorized databases, are radically reducing the complexity and increasing the performance of spatiotemporal workloads.  Vectorization is extremely efficient at calculating changing geometry over time.
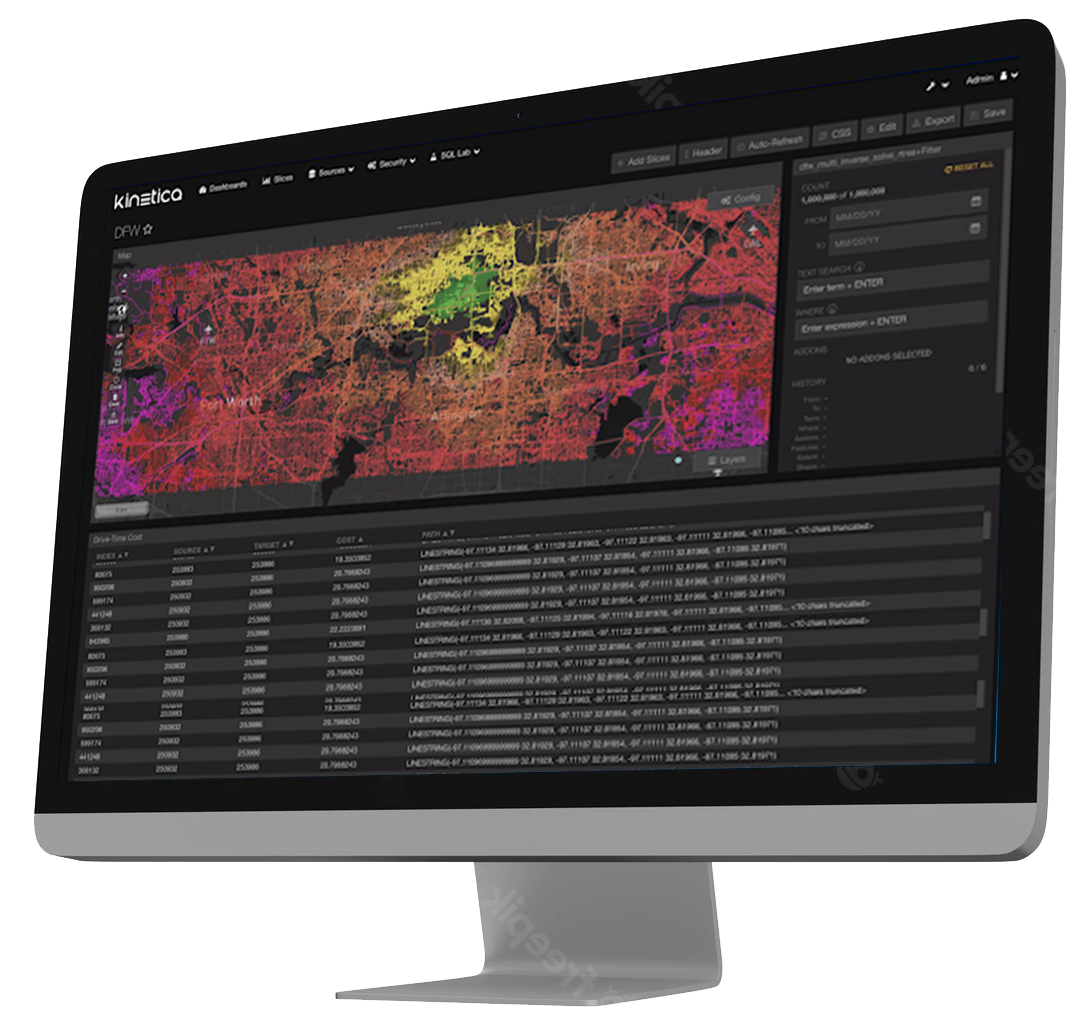
Kinetica enables interactive exploration of massive quantities of streaming data.

You can’t use an old map to explore a new world
Albert Einstein

Data is Changing

Real-time geospatial data is proliferating as prices continue to fall dramatically on the technology that generates this data.

Then Now
Characteristics Static, authoritative data Streaming, noisy data
Sources Surveys (e.g., census, polls, etc.), satellites, and transactions Sensors, smartphones, telemetry, drones, closed-circuit TVs, satellite constellations, bluetooth tags
Volumes Megabytes to gigabytes Terabytes to petabytes
Velocity
  • Point in time
  • Analyzed in batch
  • Continuous streams
  • Analyzed in real-time

Uses are Changing

New and innovative uses of real-time data were first pioneered by leading tech companies such as Uber and Tesla. But those demands are being felt by many other companies and industries.

Then Now
Persona GIS Specialists Developers, Architects, Analysts, GIS Specialists
Use Cases
  • Manage transportation and utility networks
  • Urban planning
  • Retail store placement
  • Census mapping and others
  • Smart Cities
  • Industry 4.0
  • Connected Cars
  • Smart Energy
  • Smart Agriculture
  • Cyber Defense
  • Asset/Fleet Optimization
  • Precision Health
Questions
  • Where are my customers?
  • Where should we build the store?
  • What are the demographics by zip code?
  • What is the optimal route scheme?
  • Is this a cyber-attack?
  • Which plants need irrigation?
Exemplary
examples
Starbucks, Walgreens, Gallup Poll, Municipalities Uber, Ford, Apple, Verizon, Tesla, U.S. Air Force, Amazon, Liberty Mutual, British Petroleum

Tools are Changing

Modern real-time geospatial analytics tools are designed to make it easy to work with the volume, speed and noise of moving data.

Then Now
Architecture Client-Server Cloud
Tools
  • GIS applications
  • Relational databases
  • Visualization
  • Streaming
  • Spatial and time series databases
  • ML/AI frameworks
  • Server-side visualization
Recent Webinar

Modernize IoT Data Management & Analytics

Nima Negahban, CEO of Kinetica, demonstrates how Kinetica helps streamline and simplify data management when working with IoT data and analytics.

Technology Report

Making Sense of Sensor Data

As sensor data grows more complex, legacy data infrastructure struggles to keep pace. A new set of design patterns to unlock maximum value. Get this complimentary report from MIT Technology Review:
Get Your Copy »

MIT Technology Review

Kinetica: For the Next-Generation of Geospatial Applications

Kinetica is a blisteringly fast, scalable database, designed for real-time analysis of spatial and temporal data at scale

Real-time Ingest for IoT

Kinetica is capable of ingesting feeds from billions of objects as they update their position. Once that data lands, it is immediately available for query. Multi-head ingest distributes ingestion across all nodes.

Geospatial Joins

Explore your data without reengineering it first. Kinetica's vectorized architecture opens the door for responsive geospatial join queries accross multiple tables.

Over 130 Geospatial Functions

Kinetica includes a rich library geospatial functions which will help you . Identify when objects cross over thresholds, change in proximity, or deviate from a course. Kinetica natively supports points, shapes as WKT, tracks, and labels.

Time Series

Perform inexact joins across different streams of sensor data with varying timestamps. Kinetica's vectorized ASOF joins return fast results across noisy time-series data.

Solve Routes & Relationships

What is the shortest route to guide an object to 10 different destinations? How do you match points to roads on a map? Kinetica's Graph capabilities make this possible.

Server Based Visualizations

Create server-side rendered visualizations from geospatial queries. Plot billions of points on a map, create heat maps, color code by area or generate animations.

Ease of SQL

Kinetica’s can be accessed through SQL as well as programmatically through the APIs. With Kinetica Workbench you can develop repeatable interactive workbooks to connect, analyze and create outputs with simple declarative SQL statements.

Fast Lookup and High Concurrency.

Kinetica is able to build high performance key-value lookup tables, for high-speed lookup and concurrency.

Scale Out

Kinetica's distributed architecture and tiered storage allows you to grow as your data grows. Kinetica scales horizontally on commodity hardware. Sharding of data can be done automatically, or as specified and optimized by the user.
Try Kinetica Now: Kinetica Cloud is free for projects up to 10GBGet Started »

What Can You Build with Kinetica?

Smart Cities Advanced Monitoring

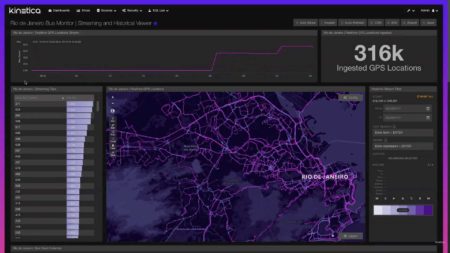
Utilize Kinetica's extensive library of geospatial functions to perform on-demand filtering, aggregation, time-series, geo-join, and geofence analysis accross massive streaming and historical geospatial data sets.

Track Entities in Real-time

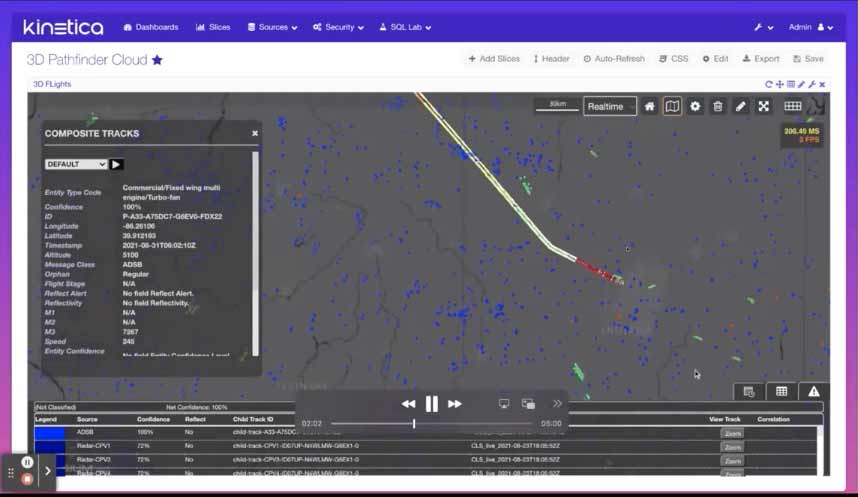
Track flights, vessels or other moving entities. This demo demonstrates how to build a common operational picture of the skies from multiple sources of data. Kinetica's AS-OF and graph capabilities enable you to derive tracks and estimate where a flight was and will be.

Connect Multiple Feeds through Time with ASOF Joins

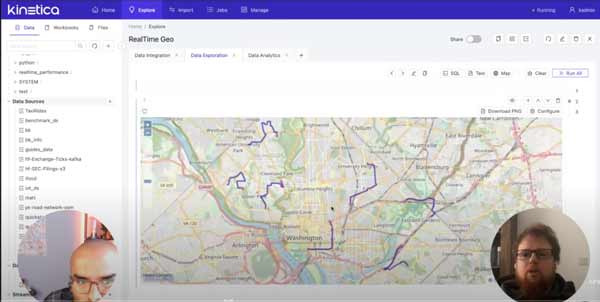
How do you connect two streaming inputs where the timestamps are different? This example shows how to perform inexact ASOF joins to connect location and sensor data where timestamps don't match.

Book a Demo!

The best way to appreciate the possibilities that Kinetica brings to high-performance real-time analytics is to see it in action.

Contact us, and we'll give you a tour of Kinetica. We can also help you get started using it with your own data, your own schemas and your own queries.