Kinetica + RAPIDS: Predict Airbnb Listing Prices in Real-Time
Build autonomous pipelines that leverage ML/AI insights in downstream applications with Kinetica

Introduction
Today, our economy is driven by data. Regardless of industry or use case, terms like Machine Learning, Artificial Intelligence, Deep Learning, Natural Language Processing , and Computer Vision have flooded our channels. The big question every industry vertical has to address is: how can we leverage these techniques, at scale, where the time-to-insight is practical and the results lead to actual revenue? To answer this, we will look at frameworks like RAPIDS and Kinetica, and how each enable the Enterprise to address their most complex problems. In many cases, machine learning not only creates incredible bottom line savings, but also provides a direct path to increased top line revenue. In this example, using public Airbnb data in the area of Berlin, we stream millions of rows of property data into Kinetica and project expected listing prices in real-time. To do this, we set up a fully autonomous pipeline that joins new incoming property data to historical geospatial information. In parallel we deploy a regression model against that data to predict a price for each listing and push the results to a downstream application for further use .
Ingesting the Training Data
A major pain point many data scientists face is actually accessing their data. Traditional industry practice typically requires complex data engineering to facilitate data movement across siloed technologies. Kinetica provides a wide suite of high performant connectors such as Kafka, Spark, NiFi and even drag and drop functionality called KIO. With this diverse toolkit and Kinetica’s tiered storage capability, we can quickly ingest large amounts of data and operate on the entire corpus, while cutting costs by eliminating the need to keep data in GPU memory.
Data Exploration and Preprocessing
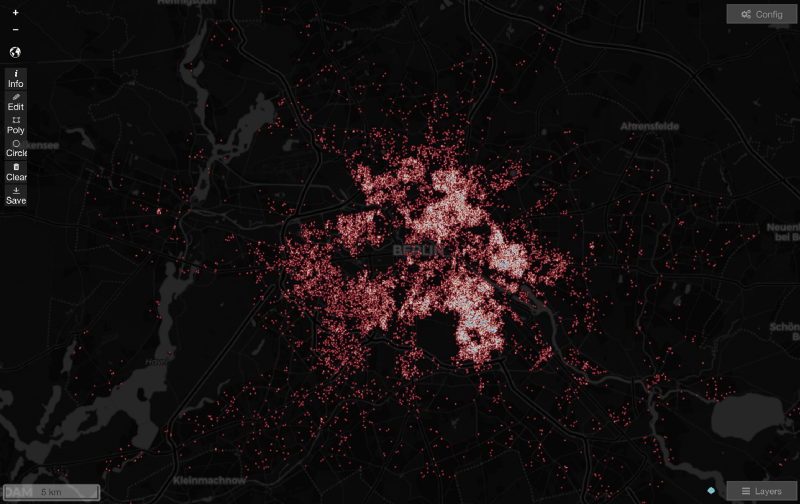
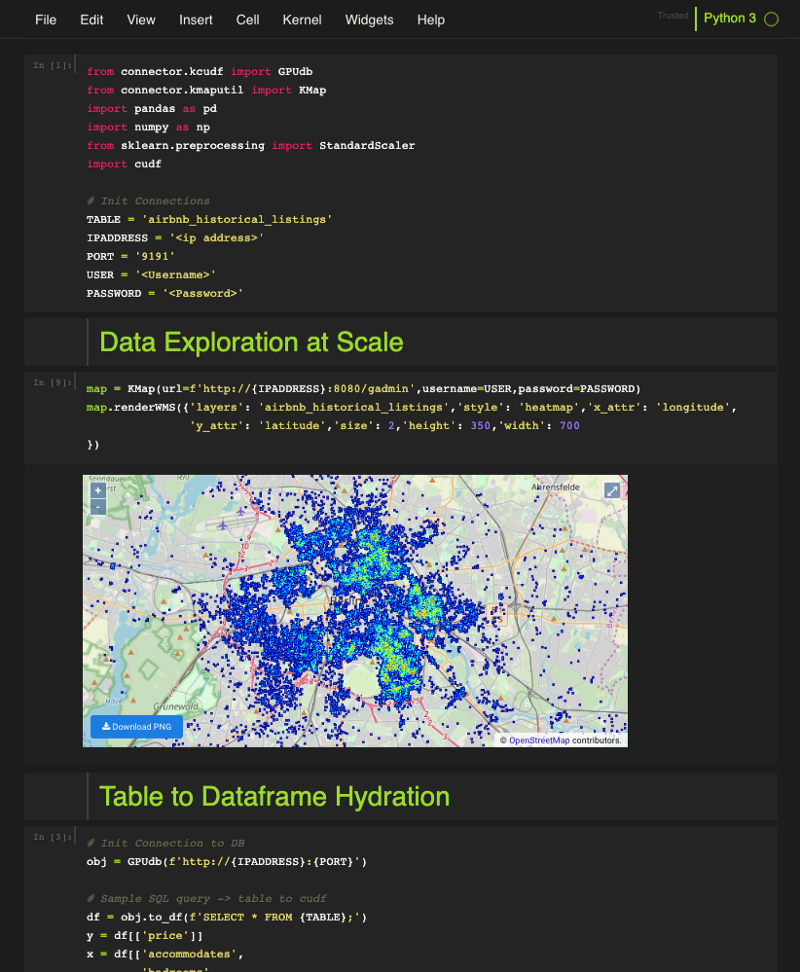
After the training data has been ingested, it’s important to explore the data and formulate an approach for model selection and development. To do this, we use Kinetica’s pre-configured Jupyter notebooks hosted natively, in the Active Analytics Workbench — Kinetica’s platform for Data Science. Here, we can pull data directly from a table to hydrate our dataframe. We can then quickly generate any traditional plots and figures needed using popular libraries like matplotlib and seaborn. We also have the ability to generate server-side WMS right in the notebook in order to better understand the data in a geospatial context.


At this point, we would like to investigate if we can geo-spatially enrich our feature set using Kinetica’s native SQL engine. We ingested public data sets containing locations of bars, restaurants, coffee shops, malls etc. We then buffered each listing by 1.5 Kilometers and determined how many of these establishments fell within each buffer, assigning a “purchasing power” score to each listing. We can now use this purchasing power index as a feature in predicting the target variable – listing price. In order to set up an autonomous pipeline that will execute these geospatial operations in the future, we create a materialized view. As new listings are streamed into Kinetica, they are immediately buffered and proximity functions are carried out to provide the purchasing power index. The model we develop will be deployed continuously against this table in order to use this geo-spatially enriched feature set.
Accelerated Training and Streamlined Deployment
Whether a data scientist want’s to conduct hyper-parameter tuning, model selection, and model training in an IDE of their choice, or leverage Kinetica’s native pre-configured notebooks, they will have access to API’s for ingest/egress, querying and containerization operations to simplify the deployment process. The general concept is that the Active Analytics Workbench is agnostic to the languages or libraries used when developing a model. This means Kinetica provides a clear path to production regardless if a user is interested in R, Python, Scikit-Learn, TensorFlow, SparkML, RAPIDS etc. First we containerize that environment and publish it to Docker. Using our SDK, we then pull that model from Docker and autonomously deploy it on Kubernetes. We simply point to the docker container URL, select an input table from Kinetica to inference against, and name an output table for the auditing information and model results to reside. A key point is that you do not need to be a Kubernetes expert to leverage this technology. At the time of installation, Kinetica will automatically stand up and orchestrate a Kubernetes cluster for the Active Analytics Workbench to be run on top of. Alternatively, if you have an existing Kubernetes cluster you would like to use, we have the tools to integrate your k8 config file with our database and install the Active Analytics Workbench on top of your pre-existing Kubernetes cluster.
Interacting With Docker From the Active Analytics Workbench
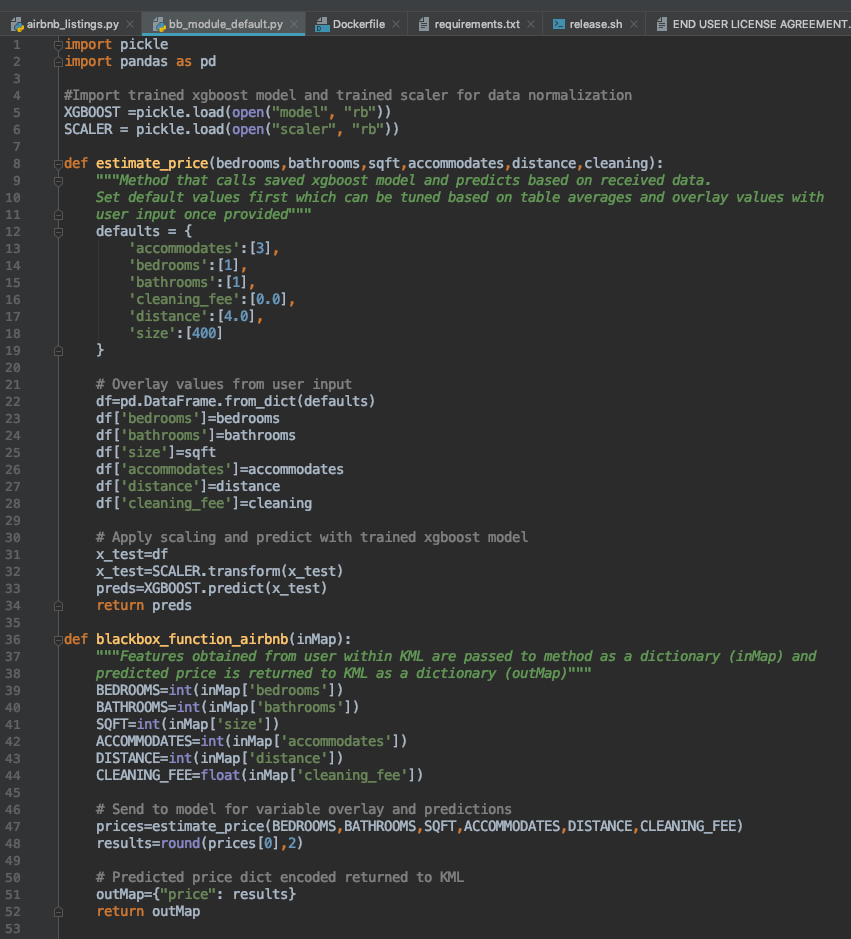
Kinetica will send data to the model as a dictionary (inMap). These values will be the features the model is expecting to use for predicting the target variable. These feature types can range from numerical data for simple regression and classification, text data for sentiment analysis, document similarity, topic modeling and other common NLP applications, byte arrays for object detection and image analysis, or even general data intended for an analytical business application. Below, we are using features such as number of bedrooms, bathrooms, size, accommodates, distance, and cleaning fee, to predict the target variable of price. Once the model receives this data and makes predictions, the results are passed back to Kinetica as a dictionary (outMap).


Inference: Performance That Meets Demand
So at this point, we are not bottle necked by ingest, preprocessing or our geospatial pipeline — that is up and running with sub second response. The limiting factor will be model performance. To test this, we benchmarked several Scikit-Learn models against RAPIDS. We containerized an Xgboost model and a RAPIDS Random Forest Regressor trained on the same historical data. We then deployed each model against the same batch of new listings which was roughly 1.1 million records. The CPU-based Xgboost model completed in 7 hours and 52 minutes. The RAPIDS Random Forest Regressor churned through the same batch in 8.1 seconds. This was a 1 to 1 comparison so 1 CPU vs 1 GPU. The performance differentiation is clear, in any practical setting for this type of workflow, leveraging the processing power of the GPU will be critical to achieve real-time results — sure you could scale up and out on CPU until you hit your inference SLA’s, but the idea behind using the GPU is to not only to reduce your hardware footprint, but also enable that complex geospatial pipeline right alongside the machine learning workflow. Finally to tie it all together, we need to push these insights out for application consumption. Once the model makes an inference, the results are automatically stored in a table. This allows us to deliver the results as a Kafka topic out to downstream applications, seconds after receiving the initial listing. We can also hit this model from an endpoint for instant ad hoc analysis and what if scenarios when deployed in On-Demand or Batch mode. Regardless of intended use, the model and resulting insights will be immediately available to seamlessly build into further applications.
Downstream Use
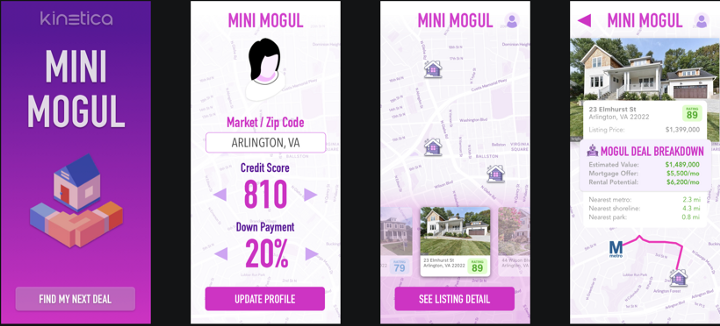
Mini Mogul is an application developed by Kinetica for demonstration purposes only.

At the end of the day, data in and of itself is technically worthless. Not until an organization can derive actual insight and convert that insight to revenue does data become a valuable asset. A critical piece to this return of investment is the ability to harness the insight gained from our machine learning model and push that to downstream applications. Above is an example of a mobile application that leverages streaming analytics, machine learning, and location intelligence to deliver estimated property values providing users faster deal evaluation and decision making. In summary, organizations using streaming and historical analytics, location intelligence, machine learning and frameworks like Kinetica and RAPIDS can tackle problems with huge revenue potential that have previously been discarded as impossible.

Big thanks to Nohyun Myung and Antonio Controneo for all of the work that went in to building this out. Saif Ahmed and Julian Jenkins for the new native Jupyter notebook environment and big thanks to Nima Negahban, Pat Khunachak, Saif Ahmed and the rest of the team for building the Mini Mogul application to tie it all together.

- Watch this AirBnb pricing demo on YouTube
- Read this datasheet to learn more about Kinetica and RAPIDS
- Watch the webinar on GPU-Accelerated Data Science with the Kinetica Active Analytics Platform
- Visit our artificial intelligence solutions page

Nick Alonso is a Solutions Engineer at Kinetica.
Making Sense of Sensor Data