Tableau Unleashed!

Fast Visualization of Large Geospatial Data Sets
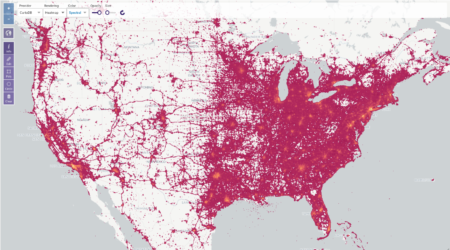
One of the core challenges with displaying large amounts of spatial information, is moving data from the database layer to the BI layer. Serializing and moving millions to billions of objects from one technology to another takes time.
But geospatial data stored in Kinetica can be rendered in-database, into a small WMS image layers, for display on top of basemaps in Tableau. This approach is blazing fast, even on massive datasets. With every pan and zoom on the map, Kinetica dynamically re-renders images using your live data source and sends them to the map.

Make data-driven decisions quickly and efficiently
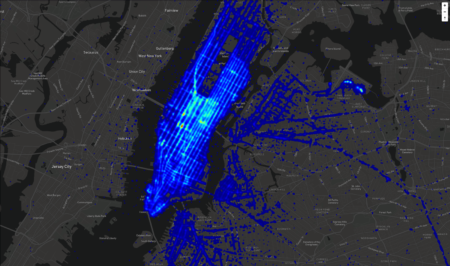
Multiple layers
Visualize and analyze different types of spatial data simultaneously. This feature is particularly useful for applications that require the integration of different types of spatial data.
Calculated Fields
Visualize and analyze different types of spatial data simultaneously. This feature is particularly useful for applications that require the integration of different types of spatial data.
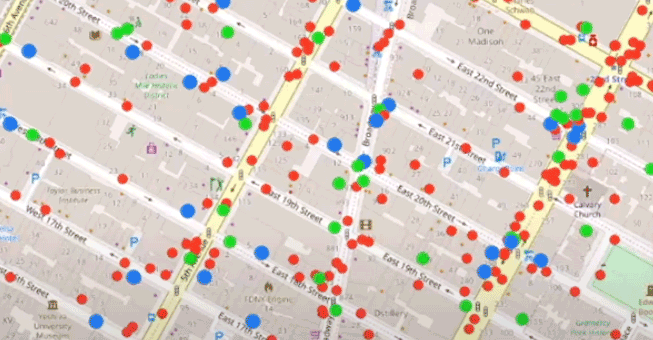
Cross-filtering...
With cross-filtering you can filter data on a map and then that data will simultaneously update in charts and tables elsewhere on the dashboard. You can cross-filter data from Kinetica directly in Tableau.
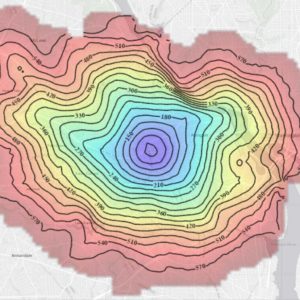
Class Break...
Visualize data using color-coded maps based on predefined classes. A class-break rendering enables you to take data from one or more tables and apply styling on a per-class basis.
Try it yourself
Kinetica Cloud is free for projects with up to 10GB of data. Sample datasets and workbooks let you quickly get started using data in Kinetica with Tableau.

Book a Demo!
The best way to appreciate the possibilities that Kinetica brings to high-performance real-time analytics is to see it in action.
Contact us, and we'll give you a tour of Kinetica. We can also help you get started using it with your own data, your own schemas and your own queries.