
In the previous post, we showed you how to import our Meetup.com data into the Kinetica database, and use Reveal to analyze and visualize this data. What if you want to create your own application to include this data and analysis? In this article, we will show you how you can use Kinetica’s Javascript API and Kickbox.js library created in collaboration with Mapbox.com to do this.
Integrating Kinetica in your own app
Kinetica offers several connectors to popular platforms such as Kafka or Spark. If you are creating your own app, you will probably be interested in using the REST API, as you can basically use it in any language or application you are building. Kinetica also offers API libraries for such popular languages such as C++, C#, Java, JavaScript, Node.js, and Python, which simplifies the process of integrating Kinetica into your app, making the lives of developers much easier.
Using Kinetica’s Web Map Service
As mentioned in previous articles, one of the areas where Kinetica really shines is processing geospatial data. This data is best displayed on the map. That’s where Kinetica Web Map Service (WMS) comes in handy.
The API endpoint can generate image tiles from the geospatial data it contains. These tiles can be used as overlays on top of the map. These images could be heatmaps, contours, or raster images with custom shapes on them.
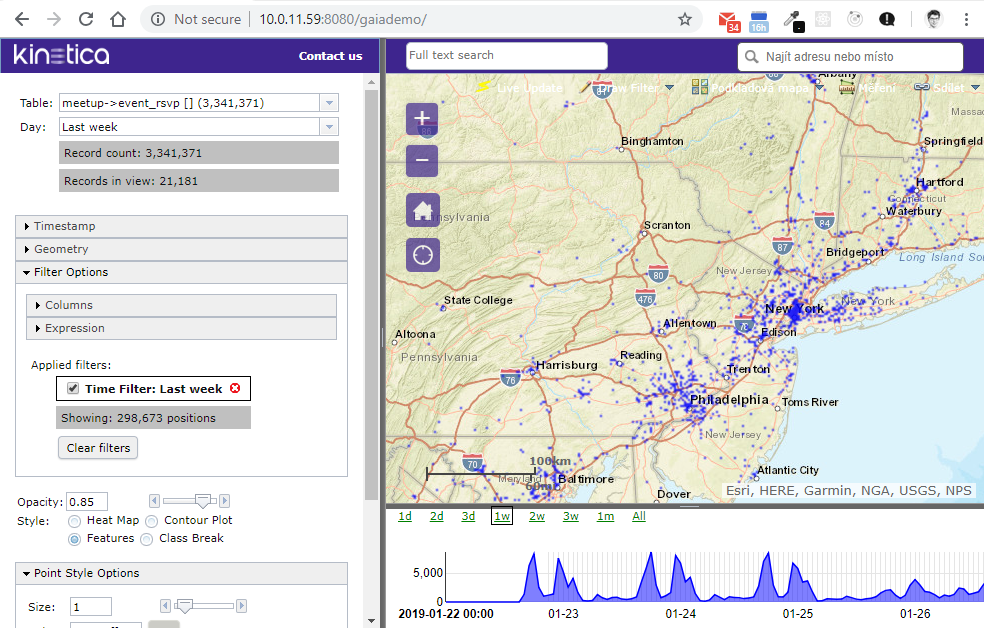
You might ask, what’s so special about this API? As you know, Kinetica runs on a GPU. Because GPUs are very fast, especially when working with graphics, these images can be rendered from millions of data points in just a few milliseconds. To learn more about WMS, check out the API documentation, and the WMS demo page running on your Kinecta instance at http://<host>:8080/gaiademo:

Introducing Kickbox.js
Web applications have become more popular than ever, and are almost always built with JavaScript. Let’s see how we can integrate Kinetica into our JavaScript application.
As we mentioned in previous articles, we are processing event data from Meetup.com, which has set locations. We would like to see this data on the map. This is where the Kickbox.js library comes in.
Kinetica Kickbox.js is a client-side, code-accelerator library which integrates the Kinetica WMS API and Mapbox GL. Mapbox is a well-known mapping platform which provides APIs and SDKs with custom-designed maps. If you need to display a map in your app, then Mapbox is a pretty safe bet.
Building our app with Kickbox.js and React
You can check out the fully working integrated project in this repository, https://github.com/profiq/meetup-analysis-kinetica, where all of the code is commented, and Javascript, app-specific problems like promises and callbacks are resolved. The following are the most important parts. Note that although we’re building our app using React, if you’re using Angular or any other JavaScript framework, the steps should be almost the same.
We started by using a classic create-react-app command for generating React apps, which sets up our project structure as a classic npm package project.
The Kickbox.js library itself isn’t yet published on npm, but we can link it directly from GitHub in our package.json like this:
“dependencies”: {
“kickbox”: “kineticadb/kinetica-kickbox-mapbox-gl”
After editing, run yarn install. Note that we are using `yarn;` it’s almost the same as npm. It’s just a different package manager, which is the default in projects generated by create-react-app.
We will also need a Mapbox library. There is one that is already in our repositories, so just run:
yarn add mapbox-gl
Displaying the map
When we have both libraries imported, we can access them in our code like this:
import mapboxgl from ‘mapbox-gl’
import kickbox from ‘kickbox/dist/kickbox.umd.min.js’
The steps are now pretty simple, and are the same as those described in the Kickbox guide.
Let’s create a div where our map will be:
<div id=’map’ style={{width: “100%”, height: “100%”}}/>
As an example, in the classic React function componentDidMount(), you can initialize the map:
kickbox.initMap({
mapDiv: ‘map’,
mapboxgl: mapboxgl,
mapboxKey: kbConfig.mapboxKey,
kineticaUrl: kbConfig.kineticaUrl,
wmsUrl: kbConfig.wmsUrl,
}).then(function(map) {
// Add a raster layer to the map
kickbox.addWmsLayer(map, {
layerType: ‘raster’,
layerId: layerId,
wmsUrl: kbConfig.wmsUrl,
tableName: kbConfig.tableName,
xAttr: kbConfig.xColumnName,
yAttr: kbConfig.yColumnName,
// or if using WKT
// geoAttr: kbConfig.wktColumnName,
renderingOptions: {
POINTCOLORS: ’00FF00′,
POINTSIZES: 3
},
});
});
Note: This code is trimmed. For the full guide, go here.
After entering this code, you should see the map right away. In case you run into any problems, be sure to dive into the web browser console. Both libraries have extensive debugging outputs which can point you in the direction of the problem:

The WMS layer
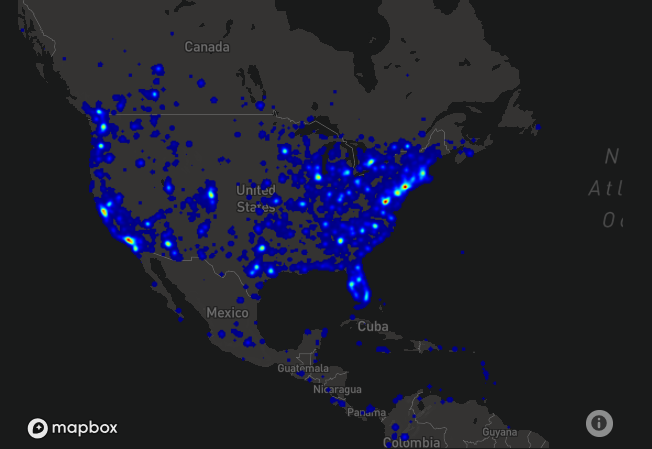
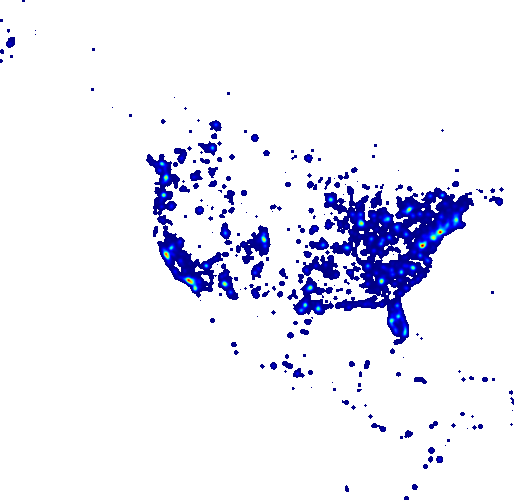
If you take a look at the Dev tab in your browser, you can see the image provided by Kinetica WMS:

The best thing about this integrated solution is that the map is automatically re-rendered when you move it, as just a chunk of the map you see is sent. This saves bandwidth, and is correctly positioned on your Mapbox background with the help of the Kickbox library.
The layer image itself is rendered inside the Kinetica DB from millions of data points in just a couple of milliseconds thanks to the GPUs.
Filtering the data on the map
Let’s see how we can filter the data on the map. If you are not familiar with the Kinetica, this might be a little bit confusing, but it’s quite straightforward once you understand it. First, we will create a new filtered table from the original table using a classic Kinetica JS API (not Kickbox). Next, we will reconfigure the Kickbox WMS layer to use this new table.
Kinetica’s API Query Tool
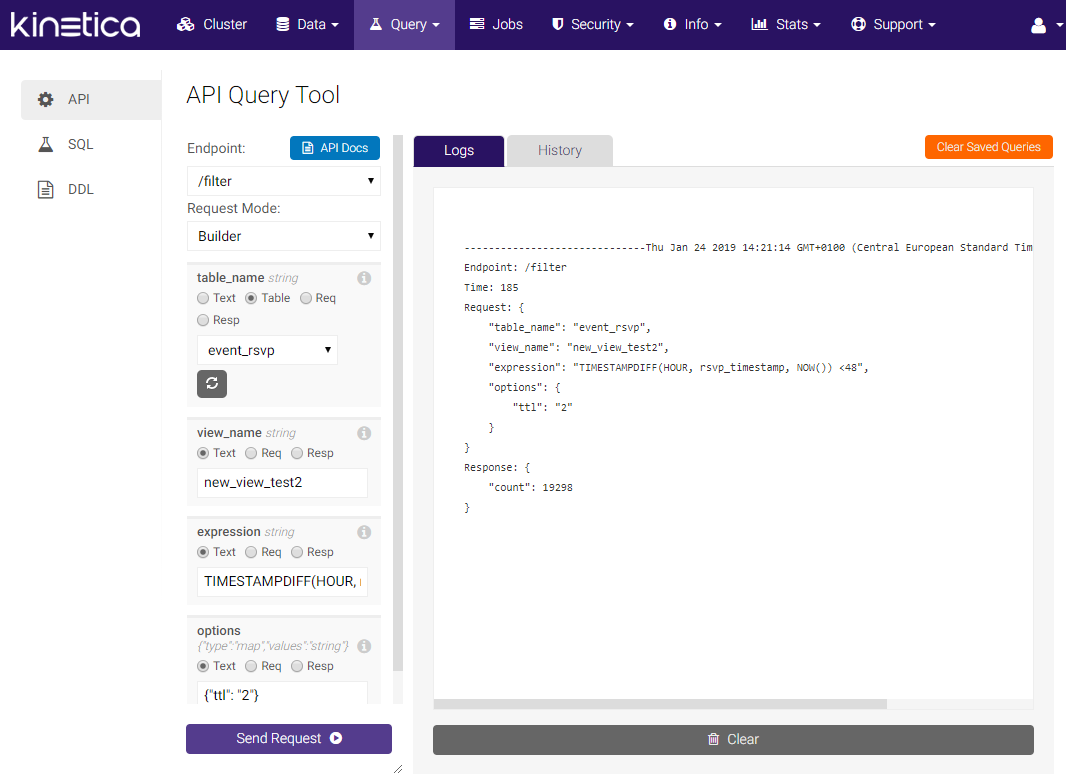
Before heading to the code, I would like to point out that you can first test your API call on the API Query Tool, which is inside the Kinetica admin panel, available here <your instance url>/gadmin/#/advancedQuery. It can help ensure that you are doing the right things before you start implementing it in your code. And if you run into any issues, you already know that your params for the API are correct:

Including the Kinetica JS API Library
First, we will need to include the Kinetica JS API. Unfortunately, it’s not yet published on the npm, so the easiest way to include it is by referencing the file in the index.html like this:
<script language=”javascript” src=”GPUdb.js”> </script>
We can get the object in the React code using this syntax:
const gpudb = new window.GPUdb(gpuURL);
Generating the filtered table
Let’s make the filter API request to the database:
gpudb.filter(‘event_rsvp’, id, `TIMESTAMPDIFF(HOUR, rsvp_timestamp, NOW()) < ${this.state.filteringTimeSpanHours}`)’
, {
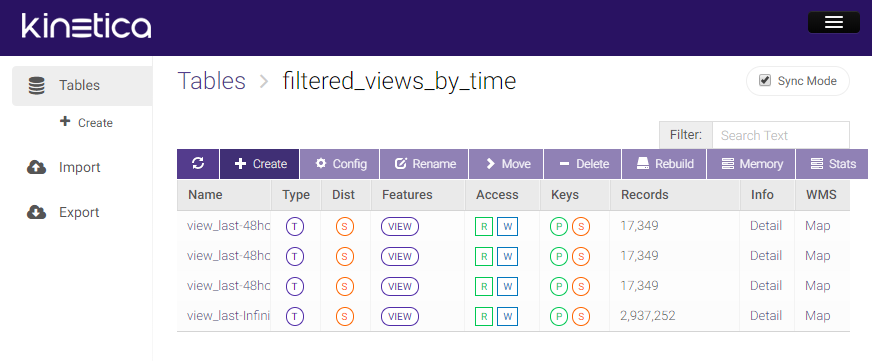
“collection_name”: ‘filtered_views_by_time’,
“ttl”: “2” // This is in minutes
}, (err) => {/* process the callback */
Let’s talk about the specific params in detail. First, we pass the name of the table we want to filter ‘event_rsvp’. Next, we have id, which is the name of the new table. We pass the actual filter we want to apply TIMESTAMPDIFF(HOUR, rsvp_timestamp, NOW()) < ${this.state.filteringTimeSpanHours}. In this case, we’re generating the difference between two times rsvp_timestamp and NOW(, which is returned in HOURS.
The last param has an object config called options; and there are two more important configs. One is called collection_name. This config sets a folder for your new tables in the DB interface, so when new tables are created, they are put into this folder, which makes navigation much easier.
The second config is TTL. This sets the length of time the tables should live before they’re destroyed (the config is in minutes). If you are going to let your users use some very unique filters, it’s good to set this to a short timespan, so your DB isn’t clogged with hundreds of unnecessary tables that are not going to be used again.
One more thing to think about is the name of the filtered table. We wanted to filter based on time (the last 24 hours). How precise the filtering should be is in question, as the timestamps are in milliseconds. If there are multiple users using the filter, we definitely want them to share the already-generated table if they have the same filter.
We set it to generate a new filtered table only every 10 seconds. This means if two people request to filter events in the last 24 hours in a span of 6 seconds, they will be served from the same filtered table:
const dateId = new Date().getTime().toString().slice(0, -4);
const id = `view_last-${this.state.filteringTimeSpanHours}hours_${dateId}`;

Reconfiguring the Kickbox WMS layer
Now that we have the new filtered table created, reconfiguring the WMS layer to use this new table is pretty simple; we just pass the new tableName (id) to the function updateWmsLayer. The rest is done automatically:
kickbox.updateWmsLayer(this.map, {
wmsUrl: this.kbConfig.wmsUrl,
layerId: this.state.layerId,
tableName: view_id
});

Other Kickbox features
It’s worth mentioning that the heatmap layer isn’t the only one provided by Kinetica WMS or Kickbox. You can also use Raster, CB Raster, Labels, and Contour layers. More importantly, you can also enable Identify Modes on your map, which is a quick way for your users to see the data that underlies your WMS output using the native Mapbox popup.cv.
Enabling it is also quite straightforward. First, install the mapbox-gl-draw, which is required,
yarn add @mapbox/mapbox-gl-draw, and import it to your code with:
import mapboxgldraw from “@mapbox/mapbox-gl-draw”.
And after you add a WMS layer to your map object, you can enable identify mod with this simple code:
const identifyOptions = {
mapboxgl: mapboxgl, // See Important Caveat section above
MapboxDraw: mapboxgldraw, // See Important Caveat section above
map: map, // The reference to your MapboxGL JS map object
kineticaUrl: me.kbConfig.kineticaUrl, // Your kinetica URL. E.g. http://your-kinetica-instance.com:9191
tableName: me.kbConfig.tableName, // The table upon which you want to run the identify queries
layerId: me.state.layerId, // A unique layer ID
xAttr: me.kbConfig.xColumnName, // The column containing the longitude (or optionally specify geoAttr for a WKT column)
yAttr: me.kbConfig.yColumnName // The column containing the latitude (Or optionally specify geoAttr for a WKT column)
};
kickbox.enableIdentifyByRadiusMode(map, identifyOptions);

Using Kinetica’s API
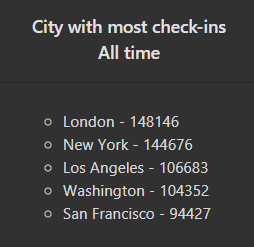
Pulling the data from the API is also very straightforward; just call one of the API functions on the gpudb object. For a list of cities with the most events, do this:
gpudb.aggregate_group_by(“event_rsvp”, [“city”, “COUNT(*)”], 0, 5, {
“sort_order”: “descending”
}, (err, response) => {
if (!err) {
let cities = [];
for (let i = 0; i < response.data.column_1.length; i++) {
cities.push({
“city”: response.data.column_1[i],
“value”: response.data.column_2[i]
})
}
this.setState({allTimeCities: cities})
}
});
After we get the data, we can display it in our own simple widget:

Conclusion
As you can see, using the Kinetica API is really straightforward. It’s completely optional to use the Kickbox library. You can achieve the same results without it, but if you need to work with WMS, we highly recommend it. The code in this article is partial; you can check out our demo application in this GitHub repository https://github.com/profiq/meetup-analysis-kinetica. All of the code there is fully commented and should really help you understand how you can implement Kickbox or just Kinetica JavaScript API library in your app.
In the next article, you can learn how you can predict event attendance with machine learning and Kinetica.
Check out the other blogs in this series: