Introduction
For companies engaged in oil and gas exploration, getting fast access to high resolution data is an important enabler for finding the right locations to drill a well before their competitors.
We worked to pioneer a solution for interactive 3D visualizations of oil basins using datasets containing over 100 billion data points – as described in Oil & Gas Engineering article and the video below
The customer solution made use of the vectorized processing capabilities of GPUs for fast visualizations at scale. This tutorial will run you through how you can use Kinetica Developer Edition to create similar 3D models with a demo dataset and just a laptop.
Analyzing the Basin Data
When a decision is made to drill a well, the costs increase rapidly as competitors buy up properties inside the basin. Each well costs millions of dollars to drill and the revenue produced by the well needs to exceed the production costs. Inaccurate or late decisions can result in substantial losses.
Finding the ideal well location is the job of geophysicists, petrophysicists, geologists, and data scientists who take vast amounts of data collected from a basin to build a subsurface map of its geological formations.
The data collected at the site often comes from existing wells. For example, a variety of exotic sensors may collect data about many attributes of the soil and rock at every 6 inches, thousands of feet into the earth. To make this information useful for finding new minerals, large algorithmic models are used to interpolate the values of attributes between the collected data points. This produces a large 3D volume of data.
Legacy Architectural Challenges
To make sense of the data, it needs to be visualized. Scientists can make more informed decisions when the data has sufficient detail. It is also important that the visualization solution is fast enough for them to interact with it in real-time. Traditionally, these needs have conflicted and either interactivity or detail is sacrificed.
A challenge of working with volumetric data is that as the detail increases, the number of data points increase on the order of N3. In comparison, increasing the detail of an image increases the data on the order of N2.
In addition, volumetric data is difficult for databases to index, because if the data is optimized for retrieval by an X-Y plane, it can't be optimized for an X-Z or Y-Z plane. Legacy databases need to optimize performance by creating indexes because their CPU or disk is too slow. Kinetica has less of a need for indexes because of the brute force power of its GPUs.
When working with billion point data sets, companies often turn to distributed solutions like HDFS or Cassandra, but unfortunately, these architectures don't allow for interaction with the data. When interactivity is desired, they work with legacy applications that support low-resolution data of under 10 million data points.
Kinetica Visualization Architecture
The Kinetica solution has been demonstrated to support interaction with data sets of up to 100 billion points. This is made possible by Kinetica's low latency and GPU-accelerated architecture. A single request can be processed by dozens of GPUs on many nodes simultaneously and can return a sub-second response.
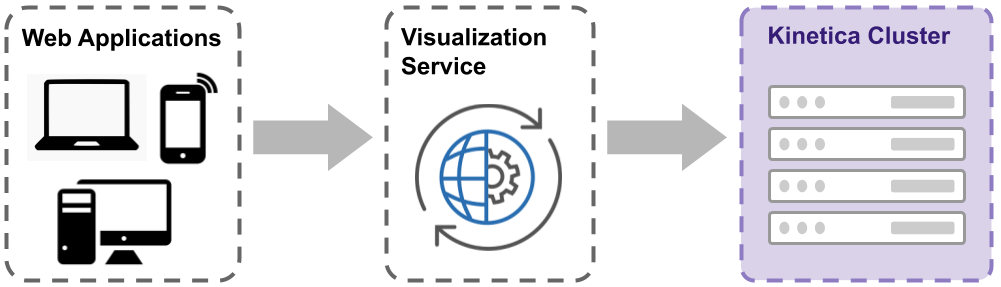
Kinetica uses a client/server model where multiple users can simultaneously request and interact with the data in Kinetica using a web application. Client applications request 3D models from a visualization service which queries raw data from the Kinetica cluster and transforms it into an industry-standard 3D format called glTF.
When a large amount of data is visualized, the data that can be transferred to and stored in a browser is limited, so tricks are used to transfer only the information the user can see on their screen as they interact with the application. Strategies for reducing data transfer include image compression, exclusion of data not visible on the screen, and progressive loading of detail.
Types of Visualizations
There are multiple forms of visualizations that scientists use to gain insight into basin formation and well data. These visualizations can range from a birds-eye view of the entire basin to high resolution details of formations between layers buried thousands of feet underground.
Hollow Tile
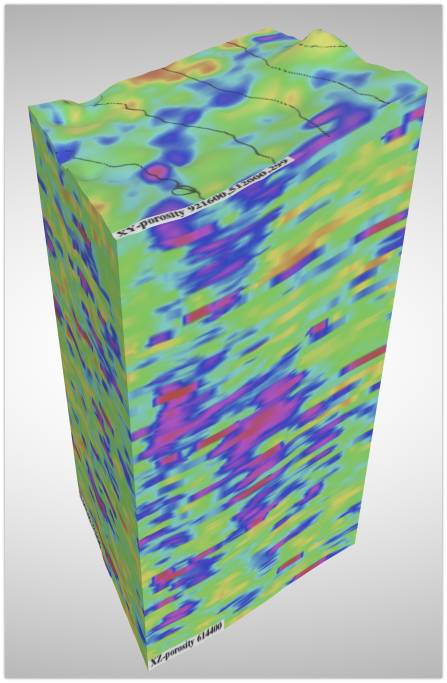
The image to the right shows a visualization called a hollow tile. It includes a part of the basin generated by projecting a square section on the surface through many layers under the surface.
The number of raw data points contained within the selected volume could be hundreds of millions and so to reduce data transferred to the browser this 3D model contains only the data visible from the exterior. This approach reduces the size of the data transfer by over 1000x.
Tile Slicing
Sometimes the user needs to interact with data inside a tile so they can closely analyze layers at various positions within the volume.
The image on the right was taken from a web application that allows for interactive viewing of various X-Z and Y-Z planes within a tile. The planes are divided up into evenly spaced images and transferred to the browser to keep the application responsive.
Well Visualizations
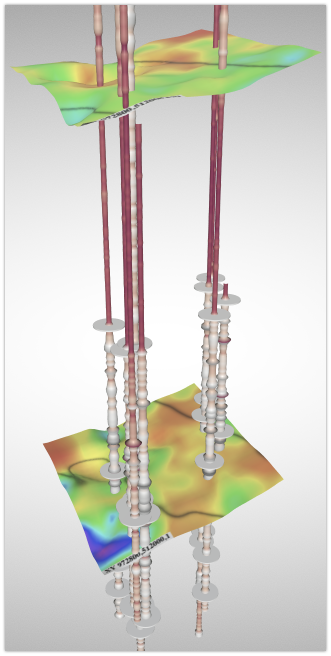
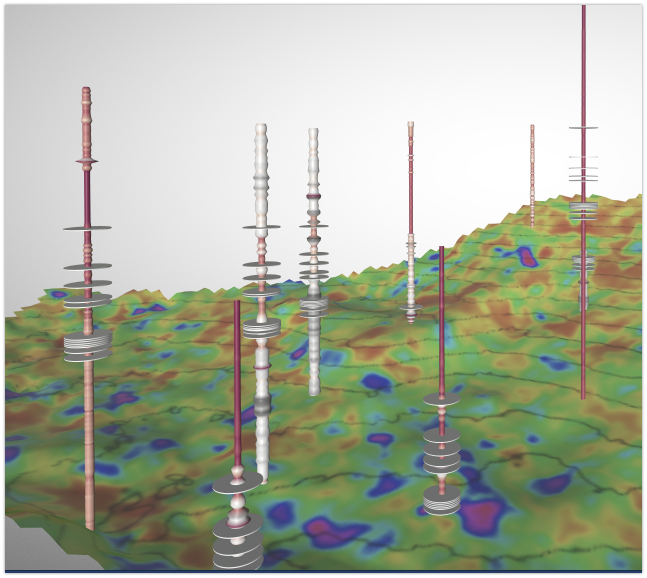
In addition to the subsurface volume, users may also want to view data from wells superimposed on the basin. The wells are represented as tube-like structures that vary in width and color to indicate the values of attributes gathered from well sensors.
The image to the right shows data from a group of wells, visualized by vertical columns, that are superimposed on a subsurface layer.
Data Organization
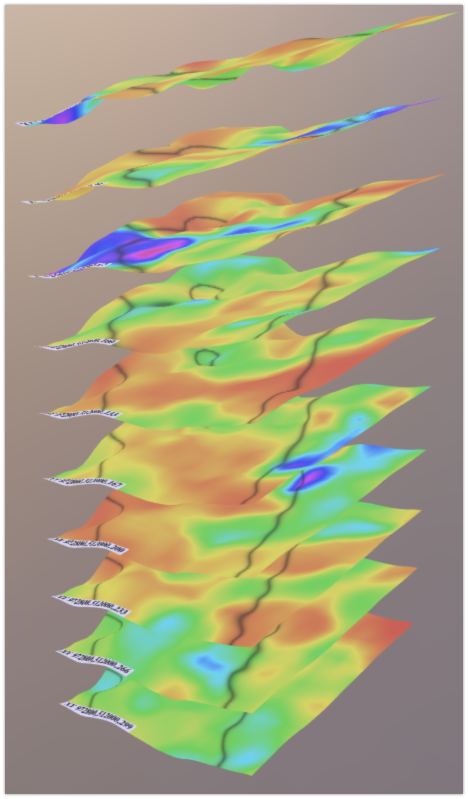
Within a basin, the geological formations are organized into layers, which is important to scientists because the minerals of interest are often hiding in pockets between the layers. Each layer represents a horizontal plane with different elevations.
When data for a visualization is selected, the horizontal boundaries are specified in longitude and latitude, and the depth is specified with a starting and ending layer. The image on the right shows a sequence of layers with elevations rendered in 3D.
The visualizations in this tutorial use data that is organized in a three-dimensional grid. Each point or voxel in the grid has an integer-based (x, y, layer) position and a corresponding fractional decimal (latitude, longitude, depth) position.
Running the Tutorial
Overview
In this tutorial we will populate a Kinetica database with a minimal data set (< 1 million points) and generate a 3D model representing a hollow tile visualization as described previously.
Before starting you will need the following:
- Access to a Kinetica instance. If you don't have this you can install one locally from a docker container.
- Java 1.8 SDK or later.
Setup
Extract the distribution zip to a local directory. Get the distribution zip file here:
You should see the following files.
[~/gvis-demo-1.0]$ ls -l
total 24088
-rw-r--r--   1 chadjuliano  staff   148K Oct 26 22:28 3dtile.jpg
-rw-r--r--   1 chadjuliano  staff   5.3K Oct 25 15:20 README.md
-rw-r--r--   1 chadjuliano  staff   283B Oct 25 10:36 demo.yml
-rw-r--r--   1 chadjuliano  staff    12M Oct 30 15:22 gvis-demo-1.0.jar
Edit the
demo.yml
file with the API connection parameters for your Kinetica instance.
---
# Configuration for GVIS Demo

# put Kientica connection details here
kineticaConnection:
    url: http://localhost:9191
    user: admin
    password: admin
Generating Simulated Data
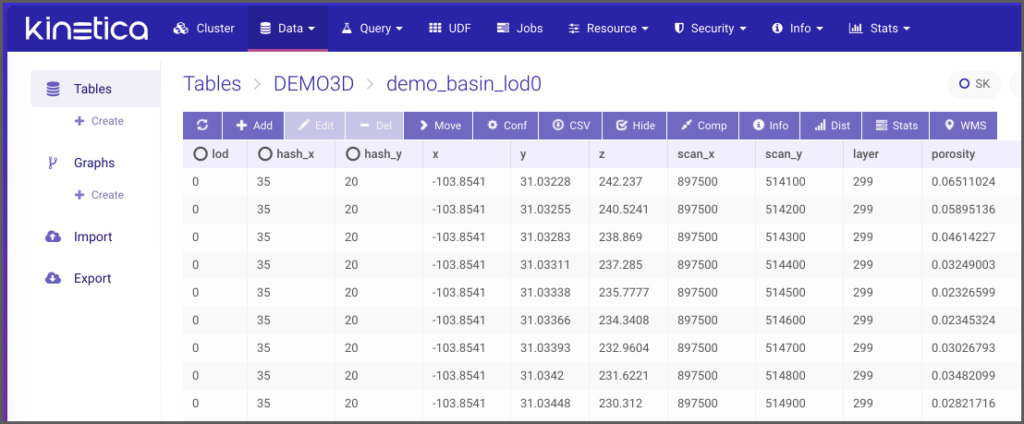
The demo data loader will create a table
demo_basin_lod0
and generate simulated volumetric data using
OpenSimplexNoise. It will generate points with varying elevations and an attribute column that will be used to
indicate a measurement of the basin at the point.
The table will be populated with 684,478 rows. This is enough data for the bounding region of a volume
with dimensions 493x246x299. In a real use case this volume would contain 36 million points, but to
reduce memory requirements it will only populate the exterior of the volume. In the visualization step
we will request a volume that is aligned with this boundary resulting to populate the hollow tile. The
table below shows the important columns of
demo_basin_lod0:
| Column | Type | Description |
|---|---|---|
| x | float | Geographical latitude (WGS84) |
| y | float | Geographical longitude (WGS84) |
| z | float | Depth in feet |
| scan_x | int | x grid position (NAD27) |
| scan_y | int | y grid position (NAD27) |
| layer | int | z grid position |
| porosity | float | Measured attribute |
It is important to note that each row has an integer-based (x, y, z) position within the grid and a corresponding geographic coordinate given as (scan_x, scan_y, depth). The integer grid must be evenly spaced and it is used by the visualizer to retrieve orthogonal planes. When a plane, such as a single layer, is retrieved from the table, it will represent a surface with different elevations.
The loader will procedurally generate terrain based on a random seed number. In the below example we pass 999 as the random seed but you can change this to any number. Each seed results in an entirely different data set. To start the loader run the command below.
[~/gvis-demo-1.0]$ java -cp ./gvis-demo-1.0.jar com.kinetica.gvis.demo.BasinLoader 999
INFO  c.k.g.d.ConfigCommon - Got config file: /Users/chadjuliano/Local/workspace/apc-3dvis/gvis-demo/target/gvis-demo-1.0/demo.yml
INFO  o.h.v.i.util.Version - HV000001: Hibernate Validator 1.0
INFO  c.k.g.d.ConfigCommon - Connecting to Kinetica: admin@http://localhost:9191
INFO  c.k.g.d.BasinLoader - Clearing table <demo_basin_lod0>
INFO  c.k.g.d.BasinLoader - Creating table <demo_basin_lod0> with type ID <9355741195739408978>
INFO  c.k.g.d.BasinLoader - Populating layer for: layer=299 area=x y
(...)
INFO  c.k.g.r.AttributeMetadata - Attrib JSON: {"porosity":{"stdv":0.11274789048865107,"mean":-0.01722200461847618,"skew":0.16019293759632575,"estimated_cardinality":0.0,"sum":585377.1266559015,"variance":0.012712086809640855,"max":0.0,"min":0.0,"kurtosis":2.5751307358448483,"count":684478.0,"colormap":"HSB"}}
INFO  c.k.g.d.BasinLoader - Loading done!
INFO  c.k.g.d.BasinLoader - Job completed.
After the loader completes you may want to view the data in GAdmin.
Generating The Model
The visualizer will connect to the Kinetica database and fetch orthogonal X-Y, X-Z, and Y-Z planes of
rows from the table. It will then generate textures and 3D geometry to produce a 3D tile. The demo
visualizer is a simple wrapper for the
gvis-modeler
library which handles the data retrieval and 3D geometry setup. The following table lists some
important components.
| Name | Description |
|---|---|
| gvis-modeler | Top level library that retrieves basin and well data from Kinetica and renders the visualization |
| gvis-qbuilder | Used by the modeler to build Kinetica REST queries and retrieve data |
| jgltf-mesh | Used by the modeler to for low level geometry calculations |
| jgltf | Serializes the data to the glTF file format |
The following code shows an example of how the
gvis-modeler
is invoked. It is passed a rectangle indicating the boundaries of the XY-plane (in NAD27 coordinates).
The generated tile will include all layers of the Z axis.
GridRect _rect = new GridRect(897500, 514100, 196800, 98200);
LOG.info("Generating tile for rectangle: {}", _rect.toString());

this._modeler.centerAbout(_rect);
this._modeler.addTile(_rect);

final File _outFile = GltfTileGenerator.getFile("demo_tile");
this._modeler.writeGltf(_outFile);
To run the model generator execute the following command:
[~/gvis-demo-1.0]$ java -cp ./gvis-demo-1.0.jar com.kinetica.gvis.demo.GltfTileGenerator
INFO  c.k.g.d.ConfigCommon - Got config file: /Users/chadjuliano/Local/workspace/apc-3dvis/gvis-demo/target/gvis-demo-1.0/demo.yml
INFO  o.h.v.i.util.Version - HV000001: Hibernate Validator 1.0
INFO  c.k.g.d.ConfigCommon - Connecting to Kinetica: admin@http://localhost:9191
INFO  c.k.g.p.GridRasterizer - Headless mode: true
INFO  c.k.g.p.PlaneResourcesBase - setSubSample: (xy=1 layer=1) => (xy=100, layer=1, lod=0)
(...)
INFO  c.k.mesh.GltfWriter - Wrote glTF: /Users/chadjuliano/Local/workspace/apc-3dvis/gvis-demo/target/gvis-demo-1.0/./out_gltf/demo_tile.gltf
INFO  c.k.g.d.GltfTileGenerator - Job completed.
The program should create a file
./out_gltf/demo_tile.gltf
containing the 3D model.
Viewing the Model
After generating the model, copy the model file
./out_gltf/demo_tile.gltf
to your local machine. Launch a glTF visualizer (you can use
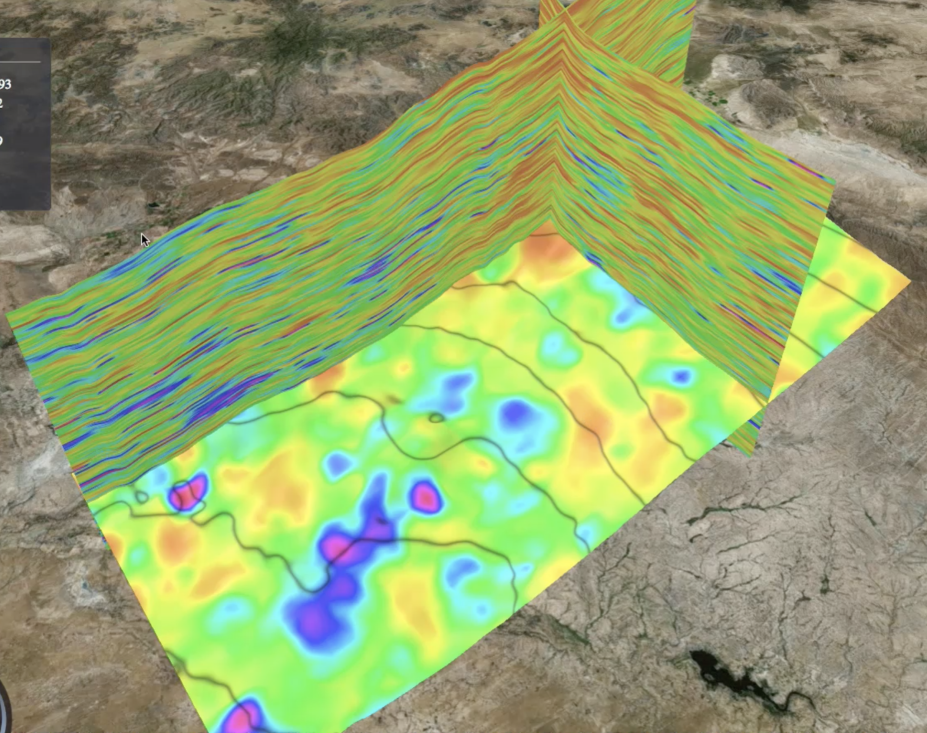
this web-based program) and open the file. You should see an image like the one below.
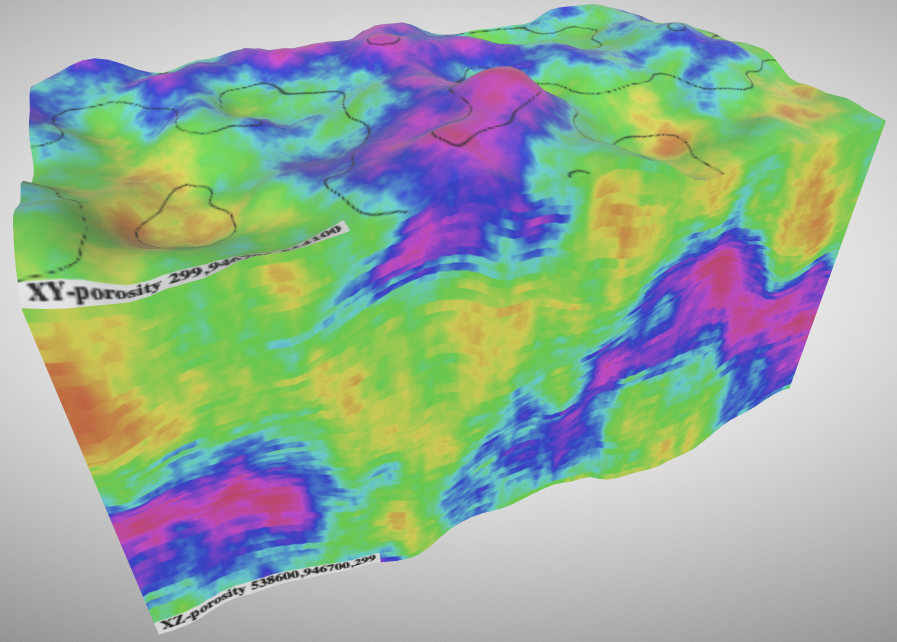
This model was generated from data that was previously loaded into demo_basin_lod0. It may appear different depending on the seed number you passed during the data generation step.
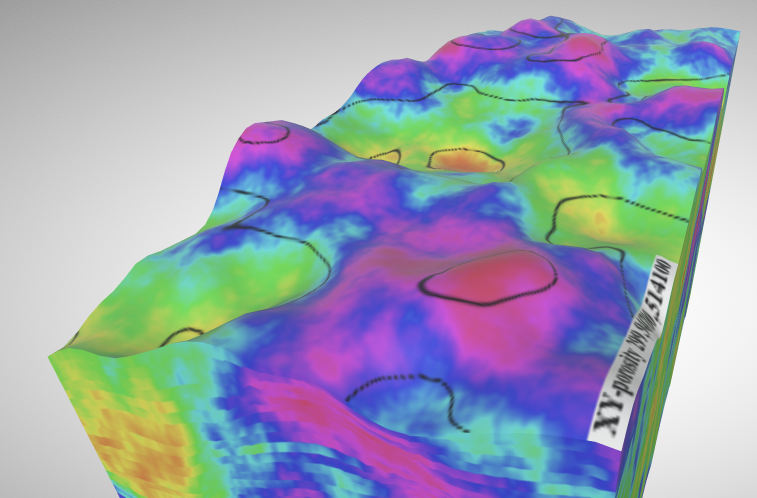
The image below shows the data from the top layer. The colors indicate the value from the attribute column. In a real use case there would be many attributes and selectable color gradients. The black lines indicate the elevation contours.
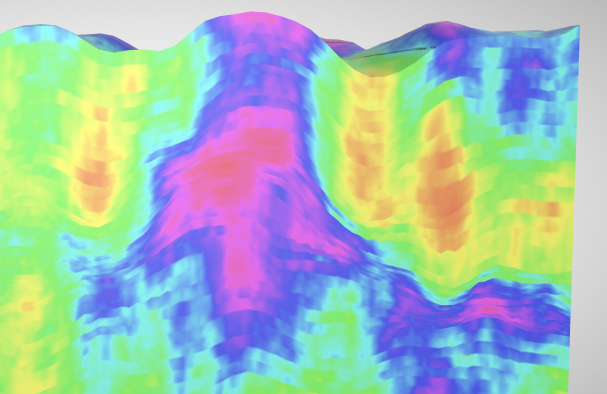
Below we can see a close-up cross section of the layers. If you look closely, you can see distorted horizontal rows that were added during data generation to simulate the type of artifacts seen in real data. Each row belongs to a layer from the grid that has been interpolated by the visualizer to match its elevations.
Conclusion
We hope you found this tutorial insightful and interesting. Due to hardware limitations, we can't show the extreme data scaling possible with Kinetica in this demonstration. For more information, see the links below for case studies with real data at extreme scales.
-
Active analytics can drive better business decisions
OIL AND GAS ENGINEERING – OCT 1, 2019 -
From Deep Learning to Next-Gen Visualization: A GPU-Powered Digital Transformation
NVIDIA GTC presentation – March 18, 2019 -
GPU-Accelerated Analytics for the Energy and Oil & Gas Sector
Kinetica industry resource page