
With the rise of GPU computing, streamlining the processing of data on GPUs has become critical to increase the speed and efficiency of machine learning. The RAPIDS open source data library is based on the Apache Arrow specification that's also at the core of the Python GPU dataframe (pyGDF). Our new open source integration with RAPIDS enables developers to use pyGDF and Kinetica to build GPU-accelerated workflows.
In this blog, we'll demonstrate the process of loading data from a Kinetica table to pyGDF, running a linear regression model on the GPU dataframe, and writing data back to Kinetica. All processes run distributedly within the Kinetica UDF.
Preparing Your Environment
- Method one:
The RAPIDS official way to use pyGDF is through Conda, you can find the setup instructions here. After that, under the Conda environment folder (/conda/envs), you will have a folder pygdf_dev that contains the environment. Copy the pygdf_dev folder to /opt/gpudb/udf/ on your server running Kinetica (GPU version). Then copy python.sh file (in the attachment) to /opt/gpudb/udf/pygdf_dev
- Method two (recommended):
To simplify the set up process, we've prebuilt a Docker image with everything out of the box.
Simply follow the instructions here.
Note:
- You need a GPU machine to run this demo.
- The Docker image doesn't include a license, to get a trial license, click here.
Preparing the Input Data and Output Table
- Use diabetes2.csv to setup an input table from admin UI (Data→ Import→ Advanced CSV Import).
- Run the following SQL to set up the output table:
About the data:
There are ten columns: AGE SEX BMI BP S1 S2 S3 S4 S5 S6 Y. They stand for age, sex, body mass index, average blood pressure, and six blood serum measurements, the response of interest.
Column Y (response of interest) is a quantitative measure of disease progression one year after baseline. We use Y as our label column, the linear regression model uses the first 9 variables to predict Y. All the input columns are standardized.
The source of data and more detailed description can be found here.
Register and Run the UDF
- Use the UDF tab from gadmin UI (UDF→ new) to register the UDF as follows:
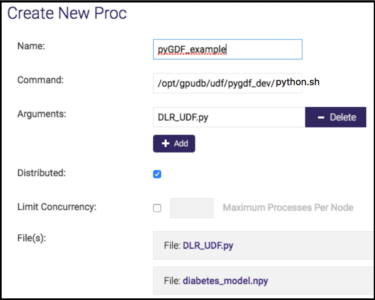
Note: If there is no UDF tab in the gadmin UI, that means UDF is not turned on. Use cluster→config, modify "enable_procs" to "true".
- To run the UDF: Choose pyGDF_example, click execute: input table-> diabetes2, output table->diabetes2_output.
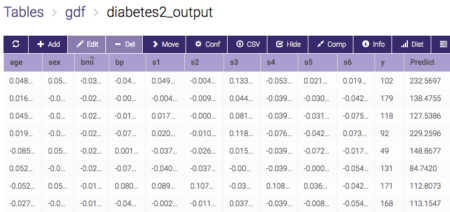
If everything runs through, you will get an output table like this:
Code Details
There are two files registered in the UDF above, DLR_UDF.py contains the code and diabetes_model.npy has the linear model parameters.
The picture below is a screenshot of the main function in DLR_UDF.py:
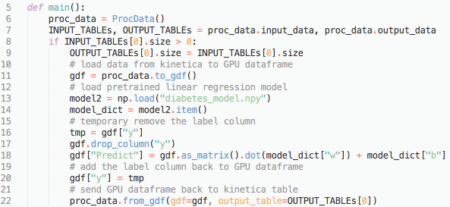
Line 11: Method to_gdf loads diabetes2 table from Kinetica into a GPU dataframe. Note in this case we are using one table as input. If there are multiple tables as input, then to_gdf will transform all input tables into a dictionary object {table1: GPU dataframe1, table2: GPU dataframe2, …}.
Line 18: Using model parameters and input to calculate the result and write back to
"Predict" column in GPU dataframe. It first transforms the full dataframe into a matrix using the
as_matrix method from pyGDF, then uses
broadcasting
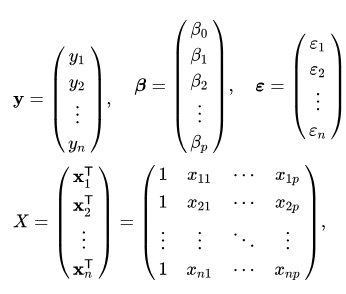
to do the simple math: ![]() where
where
Line 22: Method from_gdf writes GPU dataframe back to an output table using the from_gdf method.
If you are interested in the implementation of the to_gdf, from_gdf, you can find it in the UDF API (see attached file kinetica_proc.py).
Resources
Zhe Wu is a data scientist at Kinetica.