Kinetica was built from the ground up with a native REST API, enabling both SQL-92 query capability and a wide variety of open source connectors and APIs. This post shows just how easy it is to interact with Kinetica through some of these connectors as well as the SQL-92 query interface.
Today's data platforms are subject to demands from many different types of users and applications. Flexibility when loading, querying, and processing data becomes an essential consideration. SQL databases provide access through ODBC/JDBC, but this requires developers to build middleware services and APIs to make application integration easier and reusable. Meanwhile, NoSQL databases offer API access with Java/Python/etc., but have limited SQL support. Kinetica was built from the ground up to be flexible — with a native REST API, SQL-92 query capability, and many open source connectors.
Kinetica was built from the ground up to be flexible — with a native REST API, SQL-92 query capability, and many open source connectors.
All Kinetica APIs and connectors are open source and available in GitHub. There are connectors for Spark, NiFi, Kafka and Storm along with Java, Python, JavaScript, Node.js and C++ APIs. For more information, review the API and Connectors documentation.
Background
To start off, let's frame up a hypothetical log analytics use case: your network security team wants you to ingest NetFlow data (network packets) in real time (10s of millions of rows a day). They need a near real-time dashboard and want SQL access (with < 2s query response times) to the data for additional analytics and joins with other datasets. (This could be any kind of logs, but for this example I used NetFlow).
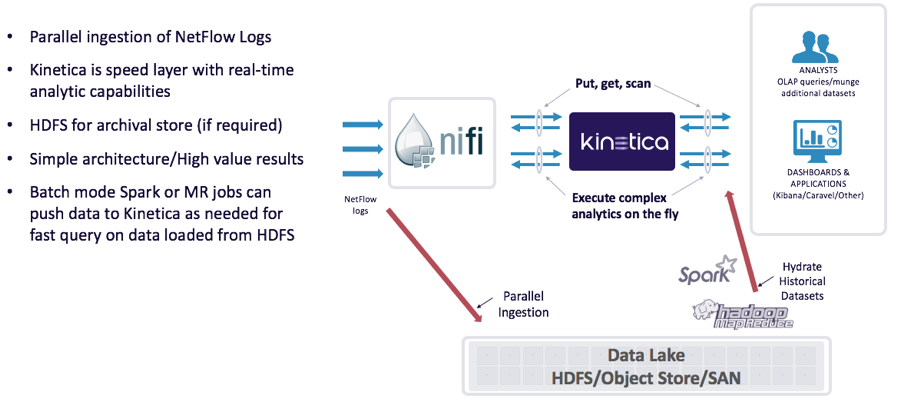
Below is the reference architecture used to ingest, process, query and visualize the NetFlow data. If this was going into production, I would recommend 30-60 days of data stored in Kinetica and the rest in a "Data Lake" for long-term storage and analytics. Note: We could have used Storm, Spark, Flume or another streaming tool.
Now let's get into the details. I quickly stood up Kinetica 5.4 on a single server (2@8 cores, 256GB RAM, 2 NVIDIA Telsa K40 GPUs, 1TB usable disk space). This is a small setup considering the amount of data that needs to be stored, but for a quick pilot, it is suitable. The good news is that Kinetica can scale out to 100s of TB of data by adding servers as needed. I then installed Apache NiFi 0.7.1 to ingest the NetFlow data quickly into Kinetica. Since Apache NiFi is Java based and Kinetica has a simple Java API, it made it super easy to get going.
Ingestion
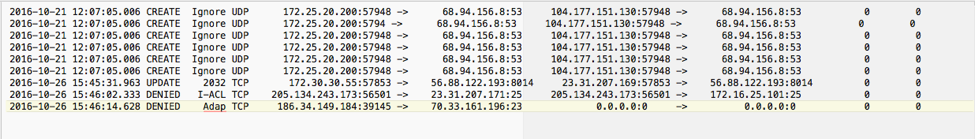
Here is what the NetFlow data looks like before ingestion: it needs to be parsed and ingested into a table for queries and analytics.
Apache NiFi detail:
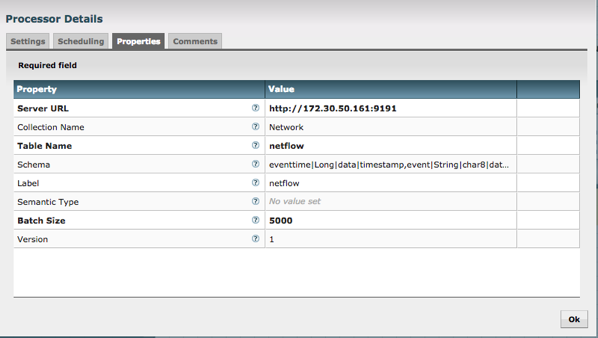
The Apache NiFi team has prebuilt templates and I grabbed the Network template to help ingest the NetFlow files. As you can see in the images below, I ingest the files, split them to single rows, Regex out the values and then load into Kinetica (with PutKinetica processor from Kinetica GitHub).
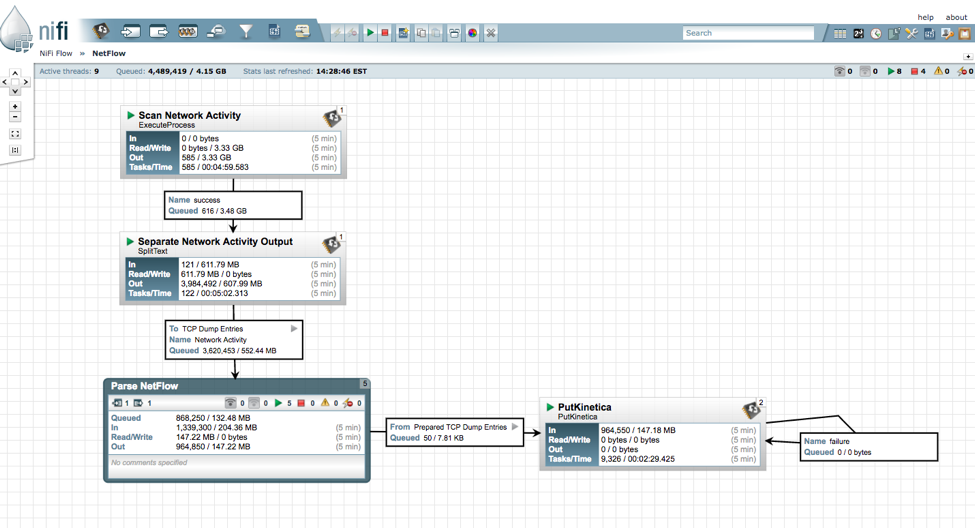
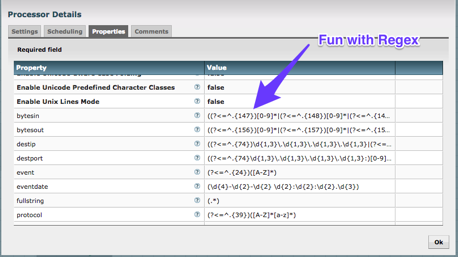
With the Kinetica NiFi processor, you provide the URL for the Kinetica instance, a Table Name and a Schema. That is it! The table is created once the processor is started and data starts streaming in. No code to write (I did write some Regex, but that was all).
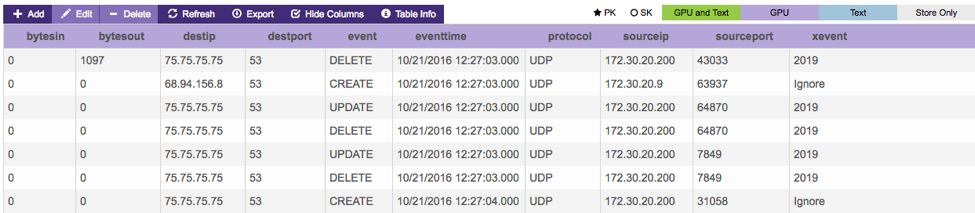
Here is what the data looks like in the Kinetica table (I loaded 110M rows in < 10 minutes). I went with a simple schema to make it easy to query. GPU acceleration yields unprecedented performance without the need for complex indexing or schema design for predetermined questions.
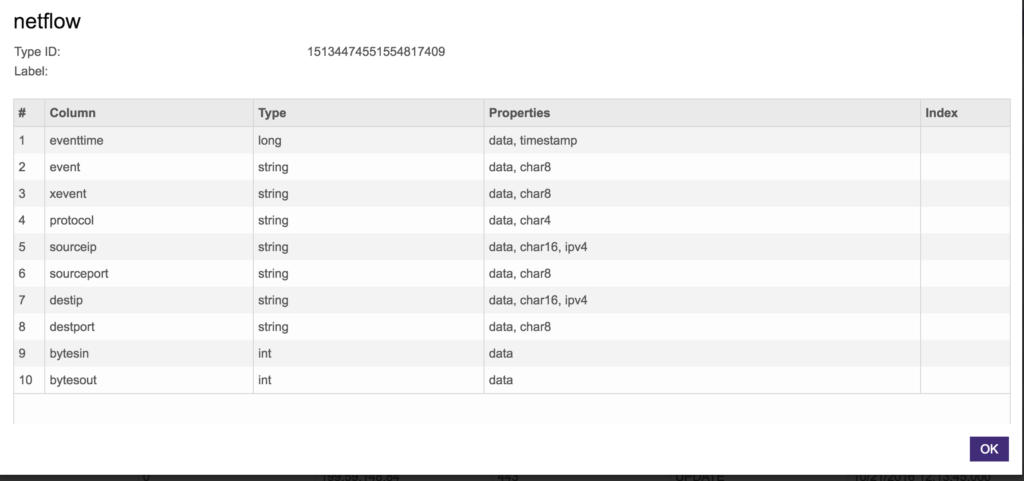
Below is the schema definition. Notice the properties column which allows for certain efficiencies like IPV4 (IP addresses) and column size (char4, char8, etc.). As is side note, we can mark columns as text_search (if you wanted to perform NLP queries on the column) or store only if you were not using the column for query aggregations but wanted it returned in a query (this is great for memory efficiency). For more details, check our documentation.
Visualization
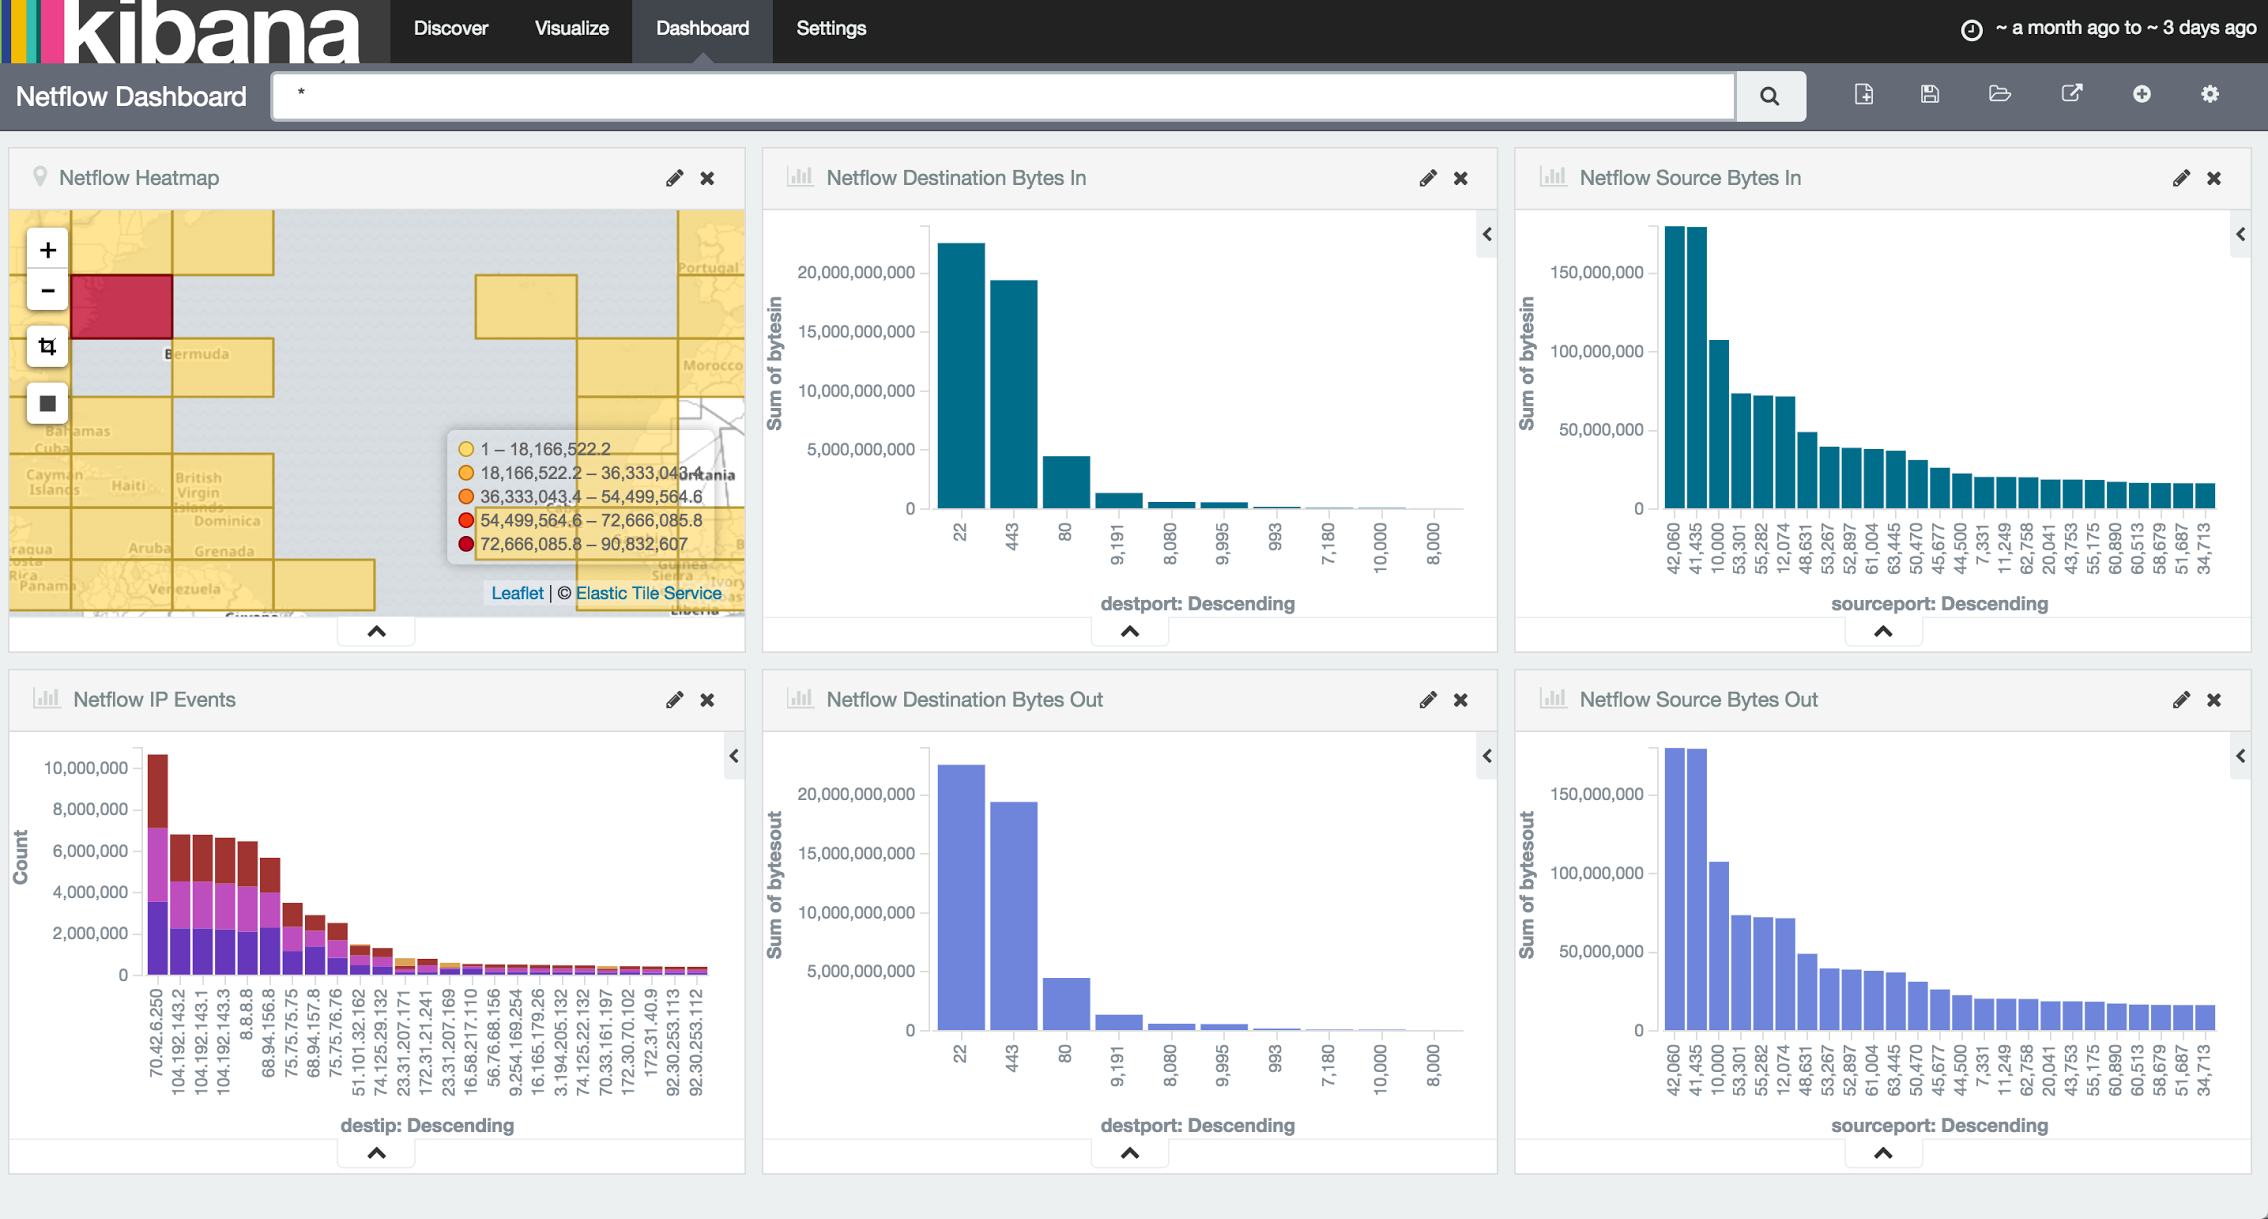
Now that there is data streaming into Kinetica, I need a dashboard that has a refresh interval and drill-down capabilities. I chose Kibana for this because it is easy to use, integrates with Kinetica and is included in Kinetica's distribution (more details here). When installing Kinetica, enable the Kibana connector in the configuration file and access the UI via http://<kinetica_host>:5601. When first accessing Kibana, it requires an index pattern and I simply put in the table name ("netflow" in this case) and voilà, Kibana can now query Kinetica. If you are familiar with Kibana, you know how easy it is to create dashboards like the one below.
SQL Query
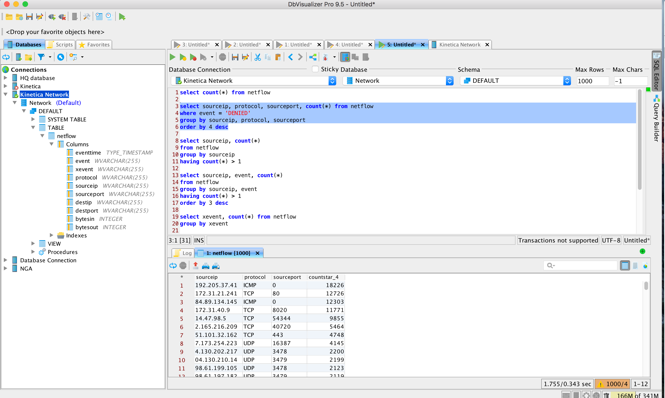
The last request was SQL-92 query access so the network team can query, enrich and run additional analytics against the data. I used DbVisualizer since it supports JDBC connectors. After setting up the JDBC connection, I had instant access to the data for queries. As you can see below, I can run queries to find IP addresses that are getting "DENIED" access (could be someone hacking into the network).
Summary
I completed all this in one day (in all transparency, the Regex was the hardest part having never done it before, so 1-1/2 days, 1/2 day for Regex) and the results are astounding. Apache NiFi made it incredibly easy to stream the data into Kinetica and Kinetica's open APIs and SQL-92 query support enabled quick integration with Kibana and DbVisualizer. What is important is this pilot project can handle production workloads just by scaling out with more servers. By the way, the Kibana dashboard and SQL queries respond in <1 second per request on the 110M row table.
In summary, Kinetica's flexibility made it easy to complete this setup in a short amount of time. It serves both SQL-92 queries and the Kibana dashboard, which would typically be done with separate tools (Elasticsearch/Kibana and a SQL database for the queries) requiring multiple copies of the data in separate data stores.
Stay tuned for Part 2 of this series where I will show you how to stream data from Kafka into Kinetica and integrate Caravel for a dynamic drag and drop user interface.