While Big Data analytics has been around for many years now, one of the most tedious and challenging processes is loading your data into a system, creating relevant charts and/or maps in a dashboard, and performing interactive analysis by applying filters to your data. Kinetica provides all the easy-to-use tools you need to load and visualize data so you can get critical insight in as little as 10 minutes.
Part of the power of the Kinetica engine is its ability to use GPUs to visualize extreme data at scale. Reveal is our easy to use web-based visualization framework for real-time data discovery with GPU-accelerated rendering of maps and accompanying dashboards. Now, business analysts can make faster decisions by visualizing and interacting with billions of data elements in real-time. Reveal also connects with Kinetica's geospatial pipeline for advanced mapping and interactive location-based analytics. When you're dealing with billions of data points, visualization capabilities are critical to make sense of all the data, spot trends, and fully understand the time and space context in which the data exists.
Your first step to loading data is to leverage GAdmin, the Kinetica admin tool. While already a capable and intuitive system administration tool by itself, it was also designed with data analysts in mind. GAdmin makes it as easy as possible to load data files of different formats including, but not exclusive to, CSV, Shapefile, Orc, and Parquet from various sources including drag-n-drop, local FileSystem, and Kinetica FileSystem (KiFS) which leverages the database as a backing store for your local filesystem. GAdmin even allows you to import directly from other databases such as Postgres. Later in our video demo, we'll demonstrate using a CSV file located on our desktop.
If you want to try out Reveal but don't have any data to ingest just yet, GAdmin provides a small but robust catalog of demo datasets. Included with these samples are accompanying Reveal dashboards which will automatically be created for you at time of ingest.

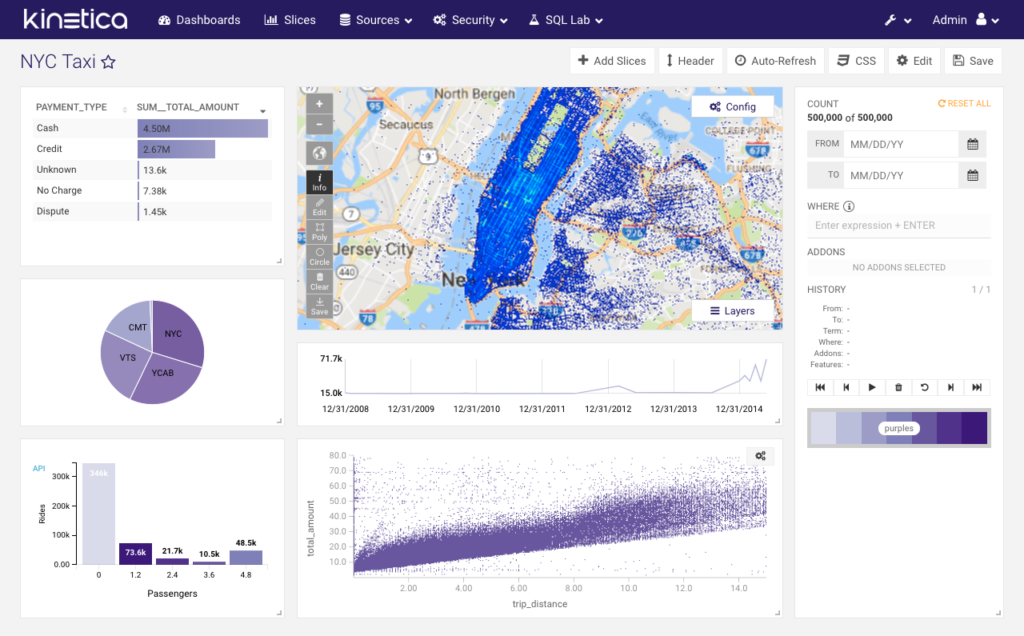
For example, if you import the NYC Taxi demo dataset, you'll automatically be able to interact with the following dashboard:
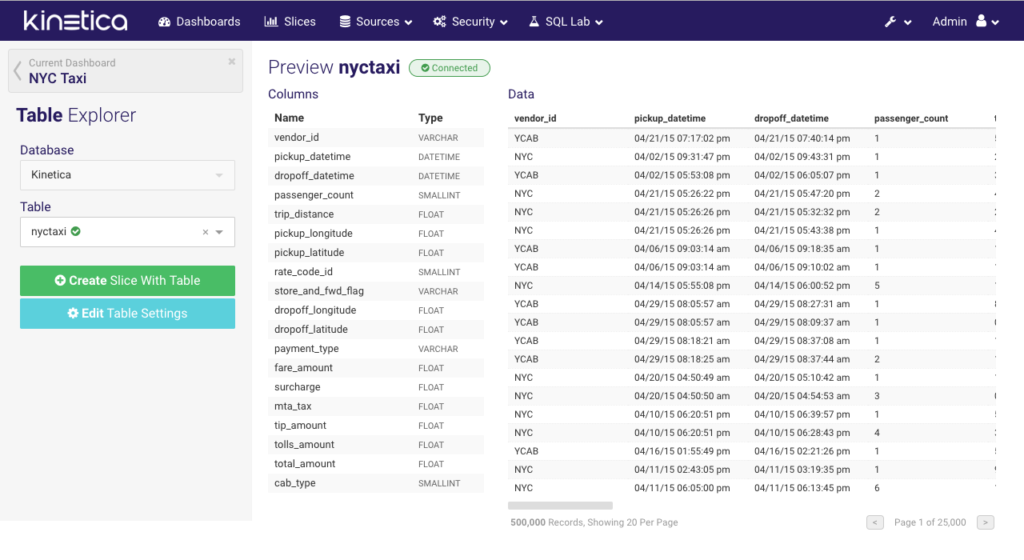
Once your data has been loaded, simply log in to Reveal which is already installed and setup out of the box with Kinetica. Reveal is integrated so that it's already aware of all the data in your database. Reveal has a convenient built-in Table Explorer tool which allows you to review your table schema and also preview sample rows data before you being to design your charts and/or maps.
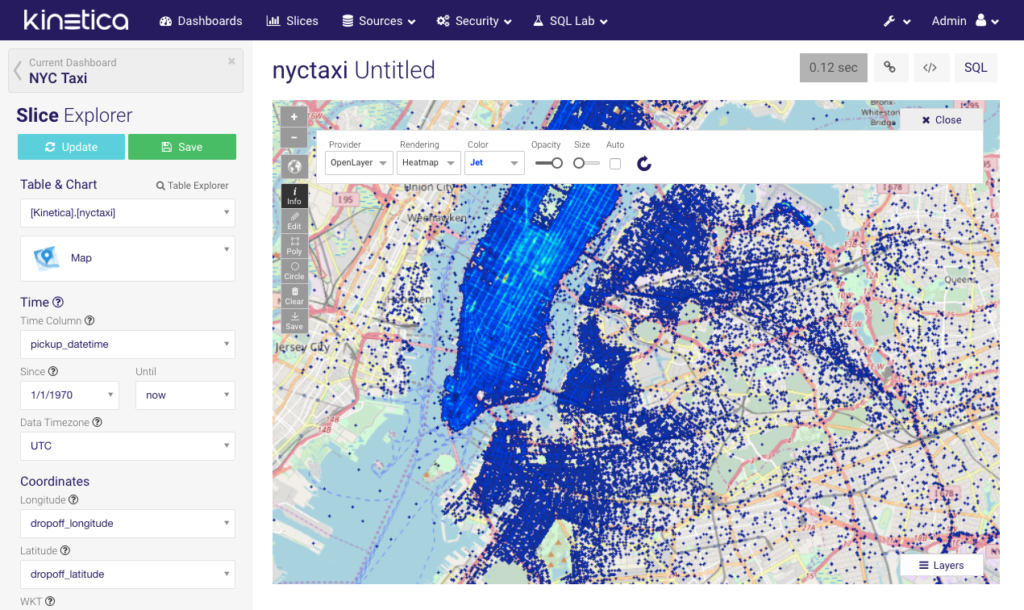
Once you've selected what data you want to work with, Reveal's Slice Explorer tool provides an intuitive interface for selecting and configuring any of the many charts and visualizations that are available. Create and add each slice you build to your new custom dashboard.
Here's an example of how easy it is to configure the Map slice.
In the following demo, you'll learn how to work with a London city commuter dataset to load, design charts and maps, and finally put it all together to create a compelling dashboard for analytics in about 10 minutes.
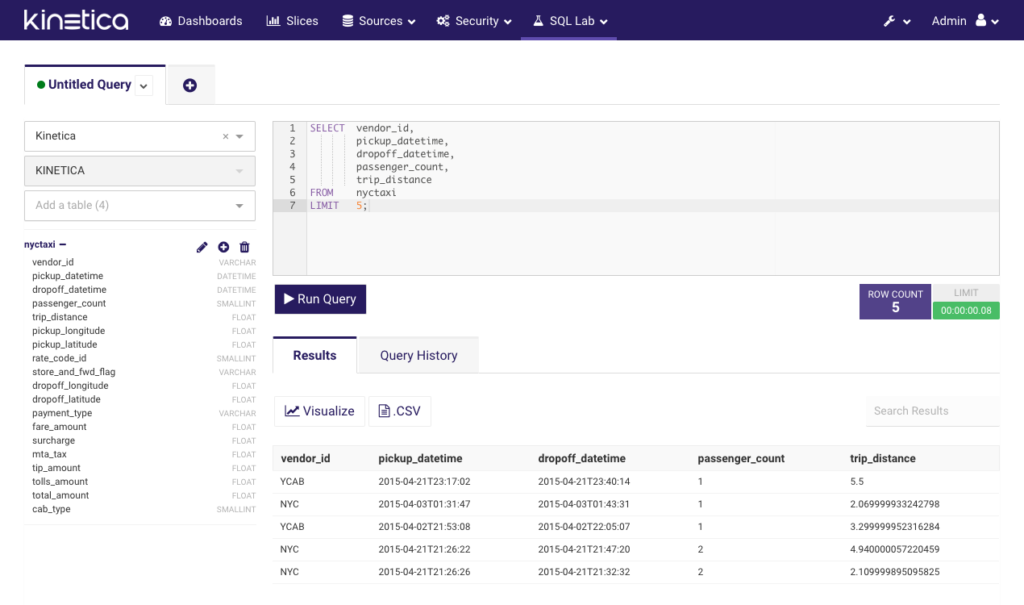
For those dedicated and loyal SQL users, Reveal also provides SQL Lab, our SQL client to Kinetica.
As an added bonus for users and developers who're looking to extend Reveal with custom charts and other visualizations, Kinetica also provides a Developer SDK that comes with Reveal. The SDK assists in development of custom modules that are plug-and-play with Reveal and can even be shared. Visit our docs for more information about the SDK. You can also find more information about Reveal here. If you're ready to give it a go yourself, get started with the Kinetica Trial Edition today!
Make sure to also register for our monthly "Kinetica Engine Fundamentals" webinar to learn how to make the most of Kinetica.
Pat is a UI Lead at Kinetica.