
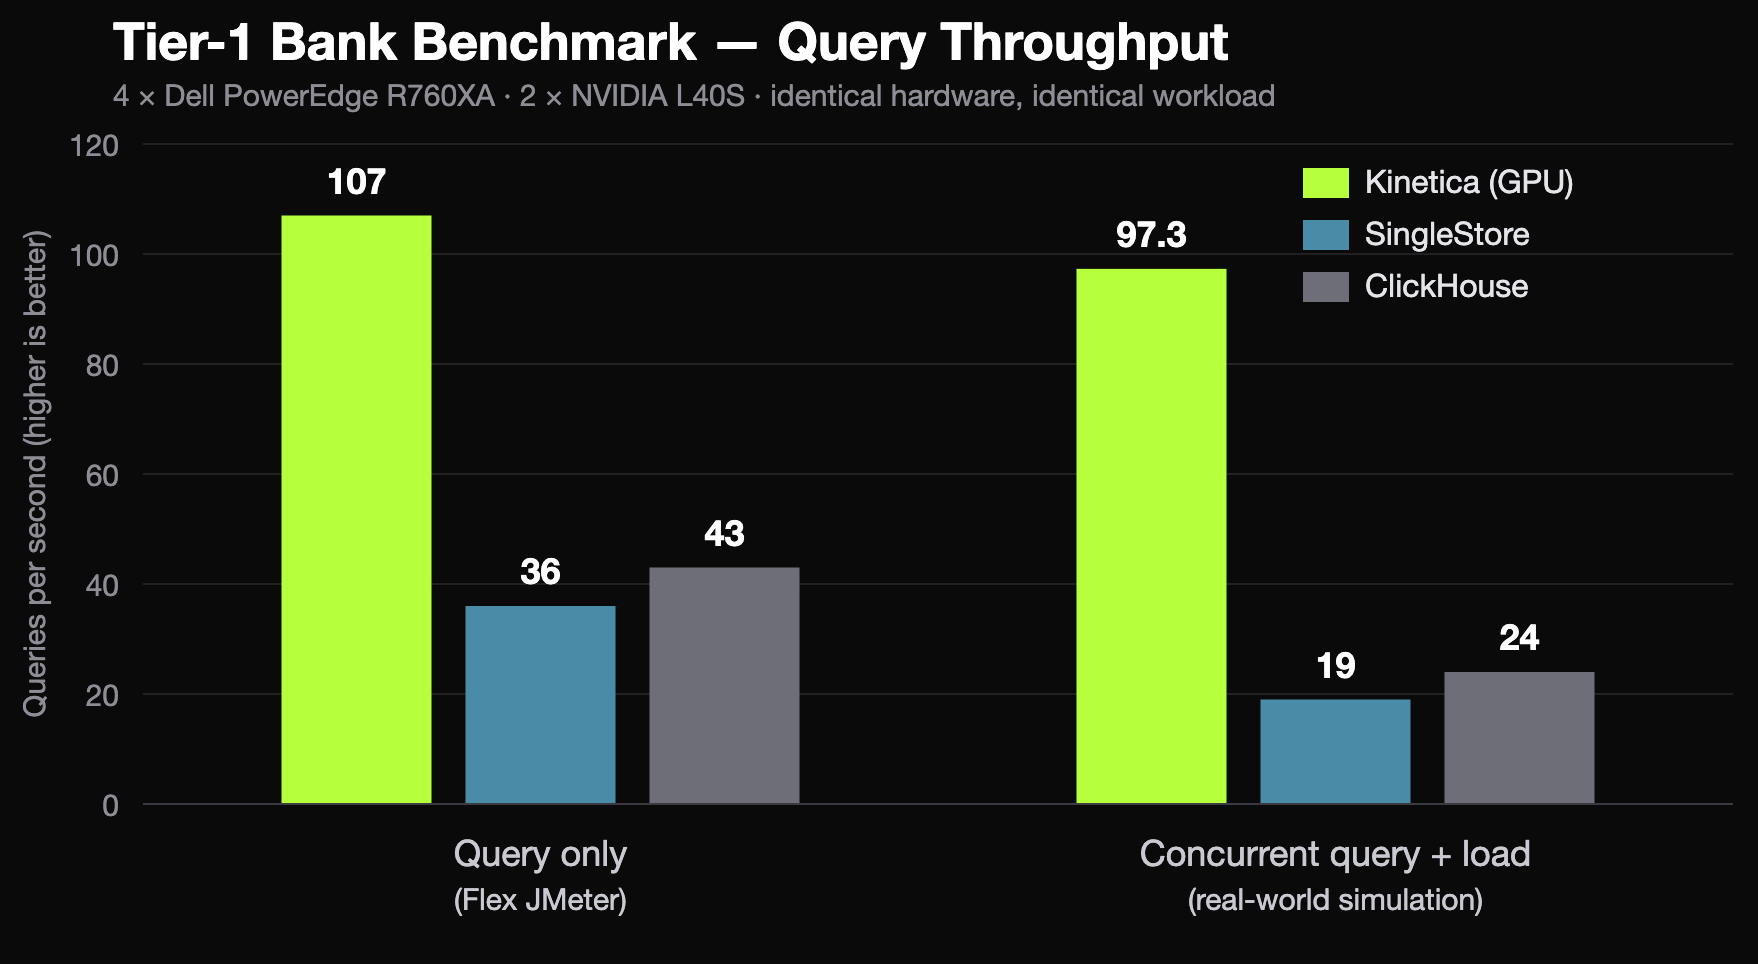
A Tier-1 global bank put Kinetica through a two-phase proof of concept against the two databases already on its shortlist — SingleStore and ClickHouse. Same hardware, same data, same queries, same JMeter harness. The workload was a risk-exposure aggregation from the bank’s own capital markets stack, not a synthetic benchmark.
Kinetica won every workload type in the evaluation, and finished all tests with a 0.00% error rate.
Two Phases, Two Labs
The evaluation ran in two stages on deliberately different hardware — first on older, GPU-modest servers to establish a floor, then on current-generation Dell hardware to see what the architecture does when it isn’t constrained.
| Phase | Location | Cluster |
|---|---|---|
| Phase 1 | Kinetica Test Lab, USA | 8 × Dell PowerEdge R620 · 20 cores / 378 GB RAM · 2 × NVIDIA T4 GPUs |
| Phase 2 | Dell Test Lab, USA | 4 × Dell PowerEdge R760XA · 64 cores / 1 TB RAM · 2 × NVIDIA L40S GPUs |
Both phases completed with zero errors across every test. Here is what each cluster delivered:
| Metric | Phase 1 (T4) | Phase 2 (L40S) |
|---|---|---|
| Query throughput | 90.4 QPS | 107 QPS |
| Average request time | 1.35s | 1.15s |
| Insert rate | 800k rec/sec peak | >600k rec/sec |
| Error rate | 0.00% | 0.00% |
What Was Actually Benchmarked
Benchmark numbers only mean something if you know what was measured, so it’s worth being precise. The query at the center of this evaluation is a risk-exposure aggregation — a PFE / margin-style exposure calculation — not a time-series scan and not an ASOF join.
Star-schema aggregation across portfolio, product, underlying and counterparty dimensions.
positions · node_ptf_arc · pm_prd · pm_undg · pm_cpty
Filtered to one calculation date per run — not a rolling time range or window scan.
clc_dt = '2022-05-27'
Scenario flags scope the query to shifted risk scenarios.
shf_1 / shf_2 / shf_3
OLAP aggregation over a position snapshot. These results say nothing about time-series or ASOF workloads — that’s a different benchmark, and we’d rather tell you which one this is than let the numbers imply more than they measured.
Head-to-Head Results
Phase 2 is where all three databases ran the same workloads on the same Dell R760XA cluster. Kinetica led every category:
| Workload | Kinetica | SingleStore | ClickHouse |
|---|---|---|---|
| Query (Flex JMeter) | 107 QPS · 1.15s | ~36 QPS | ~43 QPS |
| Concurrent query + load | 97.3 QPS · 1.25s | ~19 QPS | ~24 QPS |
| Data loading | >600k rec/sec | ~300k rec/sec | ~300k rec/sec |
| Complex SQL join | Sub-second | Multi-second | Multi-second |
| Error rate (all tests) | 0.00% | — | — |
The query-only gap is roughly 3× over SingleStore and 2.5× over ClickHouse. But the interesting part isn’t the query-only column — it’s what happens to that gap when you add write traffic.
Query and Ingest Simultaneously — Without Sacrificing Either
Most databases degrade when you query and load at the same time, because readers and writers contend for the same locks. That’s not an edge case in capital markets — it’s the normal operating condition. Positions stream in all day while risk desks query against them.
Under simultaneous query and load, SingleStore fell from ~36 QPS to ~19, and ClickHouse from ~43 to ~24 — both roughly halved. Kinetica went from 107 QPS to 97.3, a drop of about 9%:
This is what Kinetica’s lockless architecture is for. Writers don’t block readers, so the concurrent number stays close to the query-only number instead of collapsing toward half of it.
A 180 GB backup across all 4 nodes completed in 2 minutes 17 seconds, initiated by KAgent and fully automated, with restore estimated comparable.
Performance Holds Flat from 2B to 8B Records
The question that actually decides a capital markets deployment isn’t “how fast is it today” — it’s “what happens in eighteen months when the table is four times bigger.” The bank tested exactly that, running a multi-day JMeter workload while the dataset grew from 2 billion to 8 billion records.
| Dataset size | Throughput (TPS) |
|---|---|
| 2 billion records | 106 |
| 4 billion records | 100 |
| 6 billion records | 100 |
| 8 billion records | 99 |
Quadrupling the data cost about 6% of throughput. Sustained throughput stayed above 100 TPS across the range, and average response time at 8 billion records was 1.23s — still inside the same second-scale envelope as the 2-billion-record run. Capacity planning against a curve that flat is a very different exercise than planning against one that bends.
The Bottom Line
- GPU-accelerated speed — 107 QPS and sub-second complex SQL joins, 2.5–3× faster than the CPU-based systems on identical hardware.
- Scales without degradation — consistent throughput from 2 billion to 8 billion records. Performance is predictable at scale.
- True concurrency — query and ingest simultaneously at full speed. No locking, no trade-off between readers and writers.
- Beats the competition — 3× faster than SingleStore and 2.5× faster than ClickHouse on queries, widening to 4–5× under concurrent load.
Every test in both phases passed with a 0.00% error rate. For the most demanding capital markets workloads, Kinetica is production-ready.
More on how Kinetica is used in capital markets and risk: real-time risk analysis.
Want to run this kind of workload against your own data? Try Kinetica free on Kinetica Cloud or download the Developer Edition.
Benchmark environment: two-phase proof of concept conducted with a Tier-1 global bank. Phase 1 — 8 × Dell PowerEdge R620, 20 cores / 378 GB RAM, 2 × NVIDIA T4 GPUs, Kinetica Test Lab (USA). Phase 2 — 4 × Dell PowerEdge R760XA, 64 cores / 1 TB RAM, 2 × NVIDIA L40S GPUs, Dell Test Lab (USA), with SingleStore and ClickHouse run on the same cluster and the same workloads. Query workload is a multi-table risk-exposure aggregation filtered to a single calculation date and a set of shocked risk scenarios, driven by a Flex JMeter harness. Customer identity withheld at their request.