This whitepaper presents a comparative performance evaluation of Kinetica 7.2.3.2 and ClickHouse 25.10.1 using the TPC-DS SF-100 benchmark. Both systems were tested on identical hardware configurations and loaded with the same dataset using the ClickHouse-referenced TPC-DS toolkit.
Key Findings
- Kinetica completed 100% of the 99 TPC-DS queries.
- ClickHouse completed 66% of queries on a single node and 62% across two nodes.
- On shared completed queries, Kinetica was approximately 2.5× faster (single node) and 6.6× faster (two nodes).
- With full-workload failure penalties applied, Kinetica was approximately 10× faster (single node) and 16× faster (two nodes).
- Kinetica demonstrated positive scaling when moving from one to two nodes, while ClickHouse exhibited a negative scale factor.
This study highlights the importance of workload completeness, distributed execution efficiency, and realistic benchmarking methodology.
Performance Summary
| Configuration | Workload | Kinetica | ClickHouse | Speedup |
|---|---|---|---|---|
| Single node | 66 shared completed queries | 240s | 605s | ~2.5× |
| Single node | 99 queries (penalty applied) | 374s | 3,905s | ~10× |
| Two node | 62 shared completed queries | 167s | 1,107s | ~6.6× |
| Two node | 99 queries (penalty applied) | 296s | 4,807s | ~16× |
Lower execution times are better. Kinetica completed every query in all configurations; the ClickHouse figures for the full 99-query workload include the standard failure penalty described in section 2.4.
1. Introduction
Benchmarking analytical databases requires evaluating more than raw scan speed. Real enterprise workloads include:
- Multi-table joins
- Nested subqueries
- Window functions
- Complex aggregations
- Distributed coordination
- Memory-intensive execution plans
Microbenchmarks such as ClickBench focus primarily on simple aggregations and single-table scans. While useful for measuring raw vectorized scan throughput, they do not stress the optimizer and distributed coordination mechanisms required for complex analytical SQL workloads.
TPC-DS provides a broader and more realistic workload profile, including 99 diverse queries designed to simulate enterprise BI scenarios.
2. Test Environment and Methodology
2.1 Hardware Configuration
Both systems were tested on identical hardware:
No GPUs were used in this benchmark.
2.2 Software Versions
2.3 Dataset and Benchmark
- TPC-DS SF-100
- Queries sourced from ClickHouse's referenced TPC-DS testing toolkit
- Identical dataset loaded into both systems
2.4 Failure Penalty Formula
For incomplete workloads, a standard penalty was applied to each failed query:
3. Single-Node Results
3.1 Query Completion
| Database | Completed | Failed | Success Rate |
|---|---|---|---|
| Kinetica | 99 / 99 | 0 | 100% |
| ClickHouse | 66 / 99 | 33 | 66.7% |
3.2 Shared Completed Queries (66 Queries)
| Database | Total Time |
|---|---|
| Kinetica | 240s |
| ClickHouse | 605s |
Kinetica was approximately 2.5× faster.
3.3 Full 99 Queries (Penalty Applied)
| Database | Total Time |
|---|---|
| Kinetica | 374s |
| ClickHouse | 3,905s |
Kinetica was approximately 10× faster.
4. Two-Node Distributed Results
4.1 Query Completion
| Database | Completed | Failed | Success Rate |
|---|---|---|---|
| Kinetica | 99 / 99 | 0 | 100% |
| ClickHouse | 62 / 99 | 37 | 62.6% |
4.2 Shared Completed Queries (62 Queries)
| Database | Total Time |
|---|---|
| Kinetica | 167s |
| ClickHouse | 1,107s |
Kinetica was approximately 6.6× faster.
4.3 Full 99 Queries (Penalty Applied)
| Database | Total Time |
|---|---|
| Kinetica | 296s |
| ClickHouse | 4,807s |
Kinetica was approximately 16× faster.
5. Distributed Scaling Behavior
The benchmark highlights several scaling characteristics:
- Kinetica scales and achieves faster run times as nodes are added.
- Query capability remains consistent across cluster sizes.
- ClickHouse exhibits a negative scale factor.
- Query capability degrades further in multi-node configurations.
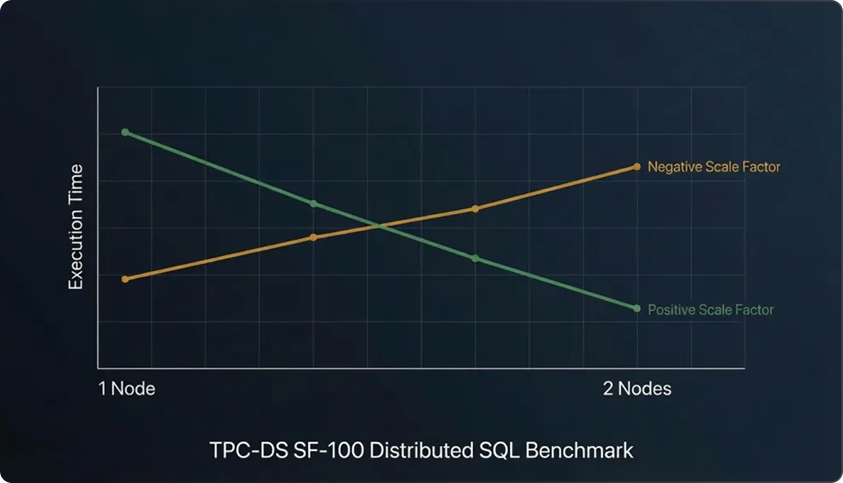
5.1 Positive vs Negative Scale Factor
Positive scale factor: Performance improves as resources are added.
Negative scale factor: Performance degrades when moving from single-node to distributed execution.
In this benchmark:
- Kinetica improved performance moving from one to two nodes.
- ClickHouse execution time increased substantially under distributed workloads.
This suggests architectural differences in:
- Distributed join planning
- Data shuffle coordination
- Inter-node communication overhead
- Query optimizer stability
- Memory pressure handling across shards
6. Architectural Implications
6.1 SQL Completeness
Inability to complete complex queries forces:
- Query rewrites
- Logic fragmentation
- External preprocessing
- BI tool limitations
Completeness is foundational for enterprise reliability.
6.2 Distributed Query Planning
Efficient distributed execution requires:
- Deterministic parallelization
- Balanced data redistribution
- Minimized cross-node joins
- Stable memory allocation
- Efficient shuffle mechanisms
Negative scaling often indicates:
- Cross-shard join amplification
- Planner fragmentation
- Excessive network overhead
- Suboptimal aggregation pushdown
6.3 Benchmark Selection Matters
ClickBench primarily measures:
- Scan throughput
- Simple aggregations
- Columnar compression efficiency
TPC-DS measures:
- Complex SQL semantics
- Multi-way joins
- Window functions
- Nested subqueries
- Distributed coordination stability
For enterprise BI and operational analytics, TPC-DS provides a more representative workload.
7. GPU Acceleration Context
This benchmark did not utilize GPUs. Kinetica can leverage GPU acceleration for additional performance gains, so the results presented here reflect CPU-only execution performance and architectural efficiency, independent of GPU acceleration.
8. Conclusion
This TPC-DS SF-100 evaluation demonstrates significant performance and capability differences between Kinetica and ClickHouse under identical hardware conditions.
Key conclusions:
- Kinetica completed 100% of TPC-DS queries across configurations.
- ClickHouse failed 33–37% of queries.
- Kinetica delivered approximately 2.5× faster performance on shared single-node workloads and 10× faster when the full workload was considered.
- In distributed execution, Kinetica was approximately 6.6× faster on shared queries and 16× faster on the full workload.
- Kinetica demonstrated positive scaling behavior, while ClickHouse exhibited negative scaling characteristics.
For enterprises running complex analytical SQL workloads in distributed environments, query completeness and scaling stability are as important as raw scan speed. TPC-DS exposes these architectural realities.
Want to see how Kinetica performs on your own complex SQL workloads? Try it free on Kinetica Cloud or download the Developer Edition.