Time-series and geospatial data is everywhere.
Kinetica was designed to harness it.

Data that contains an x, a y and a timestamp can be referred to as spatio-temporal data. Such data is often generated at high rates and volumes – from sensors, vehicles, logs, telemetry and market feeds. It has unique characteristics that are challenging for many databases to work with effectively
Kinetica solves these challenges to make time and space analytics easier – at speed, and at scale.
- How to handle streams of data at high volume? How do you keep up with large volumes of streaming data coming from many different feeds? Kinetica's multi-head ingest delegates ingest across a distributed network and is able to keep up with a torrent of data.
- High cardinality nature of spatial-time data. It's hard for general-purpose relational databases to index on high cardinality data such as timestamps or geo-coordinates. Kinetica's native vectorized architecture is uniquely designed to leverage the capabilities of modern processors for brute-force high speed query on this type of data.
- Time and spatial data require special libraries. From handling timezones and human readable dates to calculating distances and areas on a sphere; developers are used to moving data over to third party libraries to process dates and locations. Kinetica includes a rich feature set of spatio-temporal functionality in-database to reduce the time, complication and expense of moving data out to specialized systems.
- Streaming data often needs context. Sensor data typically needs to be combined with other data for it to make sense. Data from an oxygen sensor may need to be combined with data from a separate GPS unit, and contextual data about the type of vehicle it is installed on. Kinetica's rolling materialized views make it easier to fuse data from multiple feeds into easy-to-query views.
- Time & coordinates make poor keys. When working with spatio-temporal data, you'll often find you need to join tables where location and time don't exactly match. Kinetica's ASOF join functionality makes it easier to join, and make queries, on data where the key values are only close.
- How to map relationships between devices and locations? What's the optimum path between two different locations? What's the optimum routing for 1000 trucks and 10000 deliveries? How do you match a vehicles route to a road network? Kinetica's Graph API is designed to make these tasks easier.
- How to make data available to lots of customers? Streaming analytics systems typically need to pass data onto other tools to support high-concurrency requirements of applications at web scale. But Kinetica's efficient key-value lookup capabilities combined with continuously updated materialized views make it possible to serve real-time insights to large numbers of web and mobile applications directly from Kinetica.
- How to visualize large datasets? It's often difficult to move large datasets to front-end tools for visualization on a map. How do you create a heatmap from one-billion data points that are changing repeatedly? Kinetica's visualization pipeline outputs WMS overlay tiles for use with web mapping and GIS tools like ESRI.

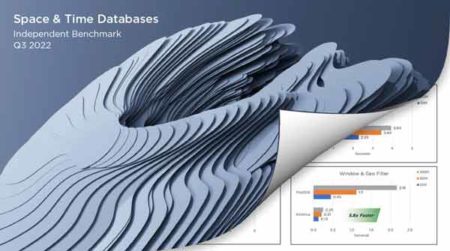
Radiant Advisors - Spatial and Time-Series Databases
"Kinetica outperformed PostGIS in every query and was the only database to pass all feasibility tests across geospatial, time-series, graph, and streaming."
Try Kinetica Now: Kinetica Cloud is free for projects up to 10GBGet Started »
White Paper
Build Real-time Location Applications on Massive Datasets
Vectorization opens the door for fast analysis of large geospatial datasets
Download the white paper

