Congratulations. You've just been promoted to Vice President of Data and Analytics at one of the largest American auto manufacturers. Before you've even had a chance to sit down, have a cup of coffee, and enjoy your corner office on the 45th floor, your new boss needs to see a forecast of new car sales of the Model XYZ for the next 2 years. Working with 10 years of sales data, how would you go about predicting car sales so that you can make decisions on what models to invest in, and what models to discontinue?
Regression analysis is a common method of making such forecasts. In this post, we'll walk through an example of how this can be done with Kinetica, an advanced in-memory analytics database that leverages GPUs for high performance.
In addition to standard SQL database queries, Kinetica can be extended to run more complex analytical calculations through a user-defined functions (UDFs) API. UDFs enable you to run custom code, in-database, on your data. Algorithms running as UDFs can natively leverage the parallel processing power of the GPU, in addition to working on data distributed across many nodes.
For our car sales forecasts, we'll use a data set containing historical car sales data. The dataset contains car sales based on make, model, and volume of sales for every calendar month of the year. We can then apply a simple linear regression prediction algorithm that goes 2 years into the future. The make and model of the car can be used as the dependent variable. The independent variable is be the number of cars sold.
The data for this demo is loaded using a simple Kinetica Ingest program.
To set up the user-defined function, you can use the Kinetica Admin UI to create the procedure, add the arguments, and add the files you'll need. To execute it, select the linear regression, specify the parameters, and click on the execute button.

Deploying User-defined Functions to the Business
These custom functions can also be made available to business users through many BI tools. In this example, we'll use Reveal, Kinetica's in-built visualization framework. You can view data as graphs, widgets, bar graphs, line graphs, time line graphs, heat maps, and geographical maps using the Reveal framework.
The first thing to do is choose a make/model of the car that you want to run your analytics on.
Let's choose the Toyota Auris model. By looking at the new car sales timeline and new car sales by month below, you can see that sales have increased significantly over the last couple years.
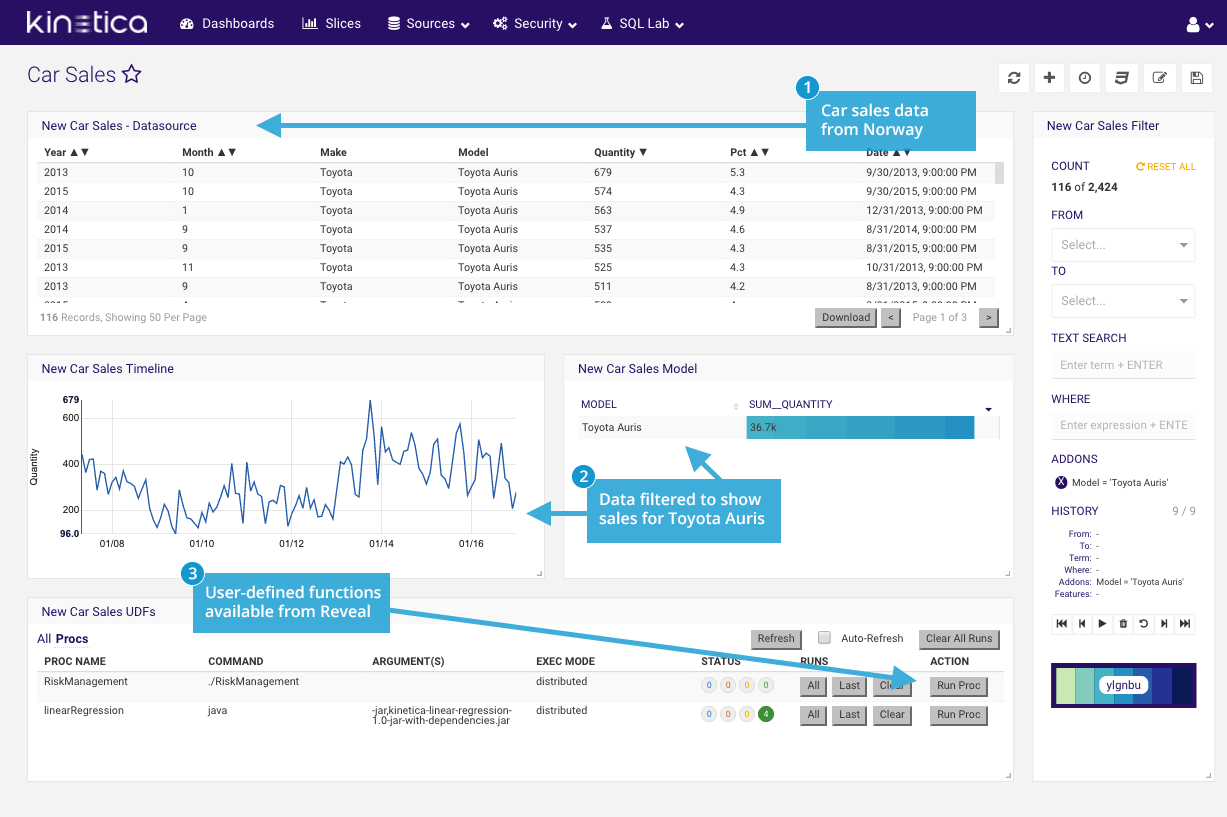
Now let's run the linear regression model to forecast Toyota Auris sales for 2018 and 2019 and sort by demand. Predicted sales are 367 in January for 2018, and 379 in January 2019. The car is forecast to sell better during the summer months than the winter months.
Some quick highlights of UDFs include:
- Advanced analytics: UDFs can include advanced analytics computations such as linear interpolation, anomaly detection, clustering, regressions, or risk simulations such as Monte Carlo analysis.
- Machine learning: Custom functions can also call machine learning/artificial intelligence libraries such as TensorFlow, BIDMach, Caffe, Torch and others to work directly on data within Kinetica.
- Extensibility: Pre-existing custom code that currently operates in separate systems can often be quickly reconfigured to run in Kinetica. UDFs open up a world of options for automating processes and performing business calculations within the analytics platform.
Full details on Kinetica's UDF frameworks are available in the documentation. You can also see this car sales demo through the Kinetica Demo.
And if this blog post has you dreaming about owning the latest Volvo S90 or Acura NSX, the biggest discounts often occur on October 30, just in time for end-of-the-month sales incentives. You're welcome.