How to Simplify Streaming Analytics Using a GPU-Accelerated In-Memory Database
Companies are facing some significant challenges when it comes to simplifying their streaming architectures. To address these challenges, organizations are turning to Kinetica’s GPU-Accelerated database to perform brute force analytics.
Both Amit Vij, CEO of Kinetica, and Mike Perez, VP of Services, explaisned more on this in their presentations at Strata + Hadoop World 2016. Mike’s full presentation is below.
Let’s look at some of these challenges that Mike addressed.
Streaming Analytics Challenges
- Solution complexity If you start looking at where customers have been struggling, primarily it’s complexities around streaming capabilities. Organizations often have to deploy and maintain multiple components that form a “single” platform, as well as multiple storage mechanisms to ingest and serve data to consumers who require real-time or deep analytical capabilities.
- Performance issues In addition to solution complexity, organizations are dealing with the complexities around compute and memory to support these multiple types of transformations. Systems struggle to ingest and perform analytic queries simultaneously, and their current systems can’t deliver acceptable response times with real-time, streaming data.
- Operation complexity From an operational perspective, you have many components to install, configure, and tune. From a DevOps perspective, it’s quite difficult to manage the maintenance and operations for upgrades for these different components.
Enabling High-Performance Data Analytics
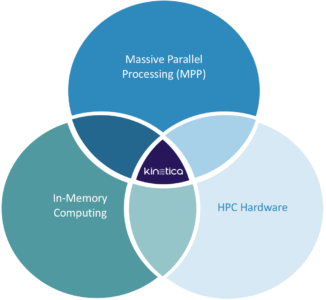
There are three core paradigms that Kinetica supports for enabling streaming capabilities:
- Massive parallel processing: Kinetica provides multiple ways to ingest and manage the data.
- In-memory computing: Kinetica delivers fast response times to complex analytical queries.
- High performance computing: Kinetica’s GPU-accelerated hardware massively improves performance with better cost and energy efficiencies.
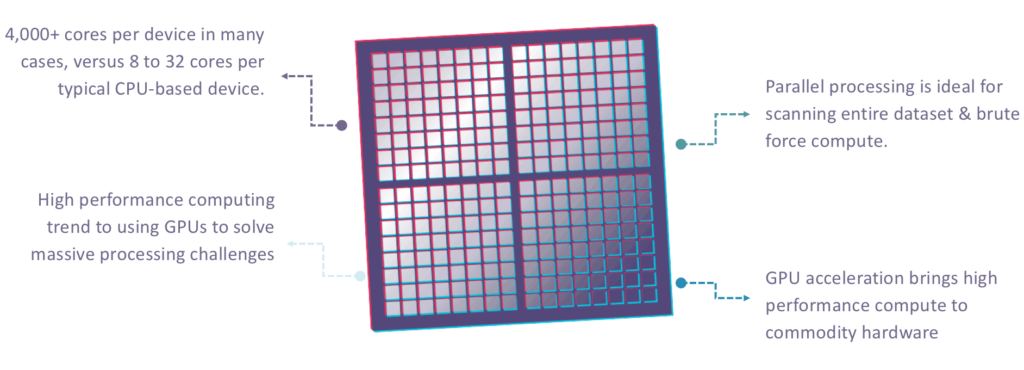
GPU Acceleration Overcomes Processing Bottlenecks
Kinetica was built from the ground up on top of GPU technology. GPU technology enables people to compute massive amounts of data because of the architecture itself. Traditional CPUs have 8 to 32 cores, whereas GPUs have 4,000+ cores in many cases. At our Strata booth, we had over 16,000 cores and one single server. If you think about the compute capabilities that you can enable with that, that’s a massive amount to compute that nothing else can touch in terms of ingestion, processing, and storage. It’s ideal for straight scanning of data set brute force analytics as well as for ingesting massive amounts of data. Users also have real-time access to SQL, Java, Python, and other tools, giving them the flexibility to decide how they want to access it.
Kinetica’s Advantages
Kinetica enables specific capabilities around ingesting at large scale:
- Performance: You can ingest large-scale streaming data, including billions of records per minute. This gives you the ability to get analytic results and visualizations in mere milliseconds.
- Scale and Savings: You can scale up or out predictably. Kinetica’s GPU architecture also gives you a smaller hardware footprint and cost, while requiring less power and cooling.
- Simplicity: Users can plug Kinetica into their existing architecture. We provide deep integration with both open source and commercial frameworks, including Spark workloads, Spark Streaming, Kafka, NiFi, StreamSets, Storm, and MapReduce. There is no typical tuning, indexing, or tweaking that’s typically associated with traditional CPU-based solutions. Kinetica also offers natural language processing-based full-text search as well as plug-ins with BI apps such as Tableau, Kibana and Caravel.
- Native Visualization Capability: Kinetica provides complete geospatial visualization capabilities via the industry-standard WMS protocol.
Challenges with Lambda and Kappa Architectures
From a streaming perspective, there are many challenges with the Lambda and Kappa architectures. Traditionally, people will stream events into Kafka and use Spark Streaming or Storm, and then will persist the data into something like HDFS or HBase. It takes a lot of effort to re-compute aggregates and to load the serving database or cache.
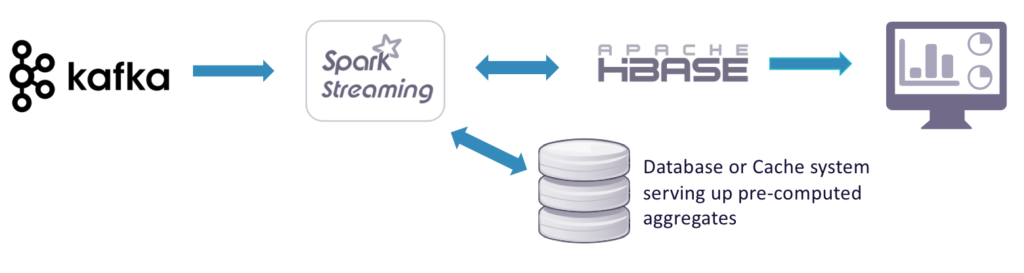
You also have to figure out how to maintain everything and ensure that your users have the SLAs that they’re looking for. You’re serving up hot data though HBase, and you’re also serving up data processing through something like HDFS so that you can visualize the data. Keeping those in sync and trying to maintain SLAs is very challenging and problematic.
Streaming Analytics – Lambda Architecture
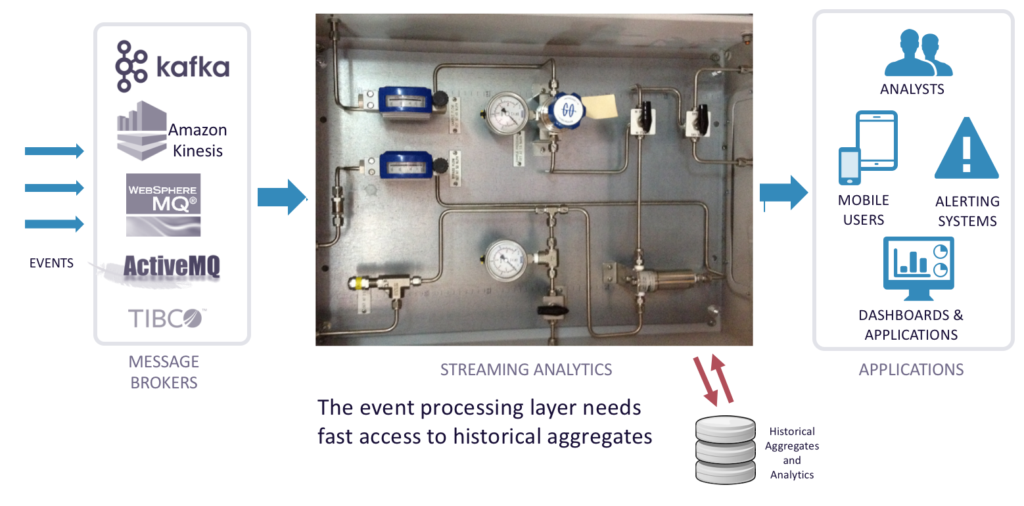
You often need access to historical aggregates that are computed against the batch layer. In a Lambda architecture, you are in a moderately tight loop, re-creating aggregates and serving them up. In the speed layer, as you analyze events coming in, you can access historical aggregates to support use cases like analyzing a stream of transaction data with user IDs.
Streaming Analytics Simplified
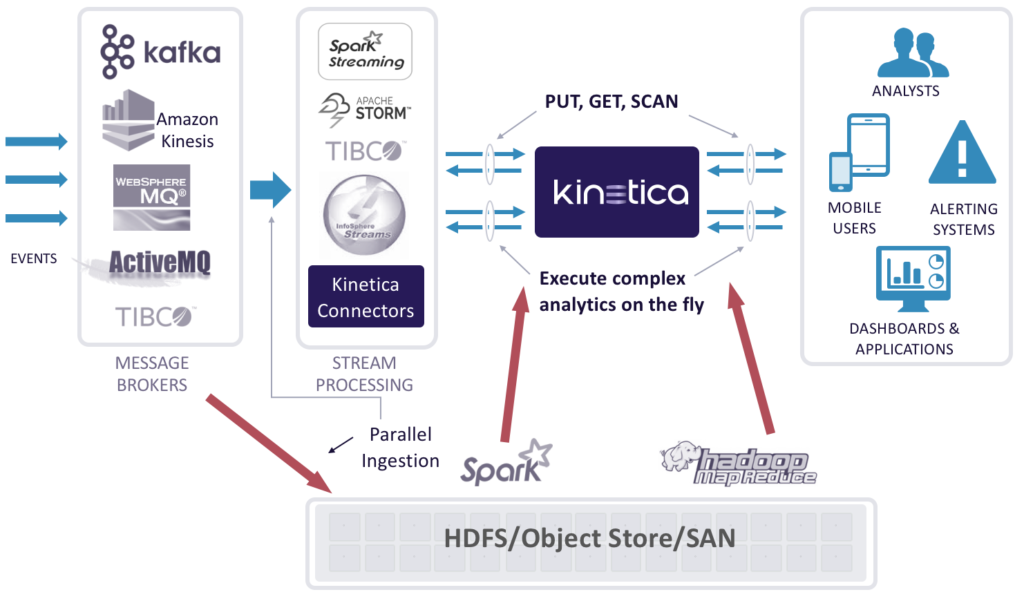
Kinetica greatly simplifies streaming analytics through the following ways:
- Parallel ingestion of events: bring events in through Kafka, Kinesis, MQ, etc.
- Kinetica is a speed layer with real-time analytic capabilities
- HDFS/Object Store/SAN for data lake
- Much looser coupling than traditional streaming architectures
- Batch mode Spark or MapReduce jobs can push data to Kinetic as needed for fast query
With Kinetica, you have one single package to install, manage, and monitor, which is very different compared to what you typically would see within a traditional Hadoop deployment. You have one simple API that you would do to ingest the data coming in, and then also serve out various capabilities in terms of providing data access across that data set.
Kinetica Architecture
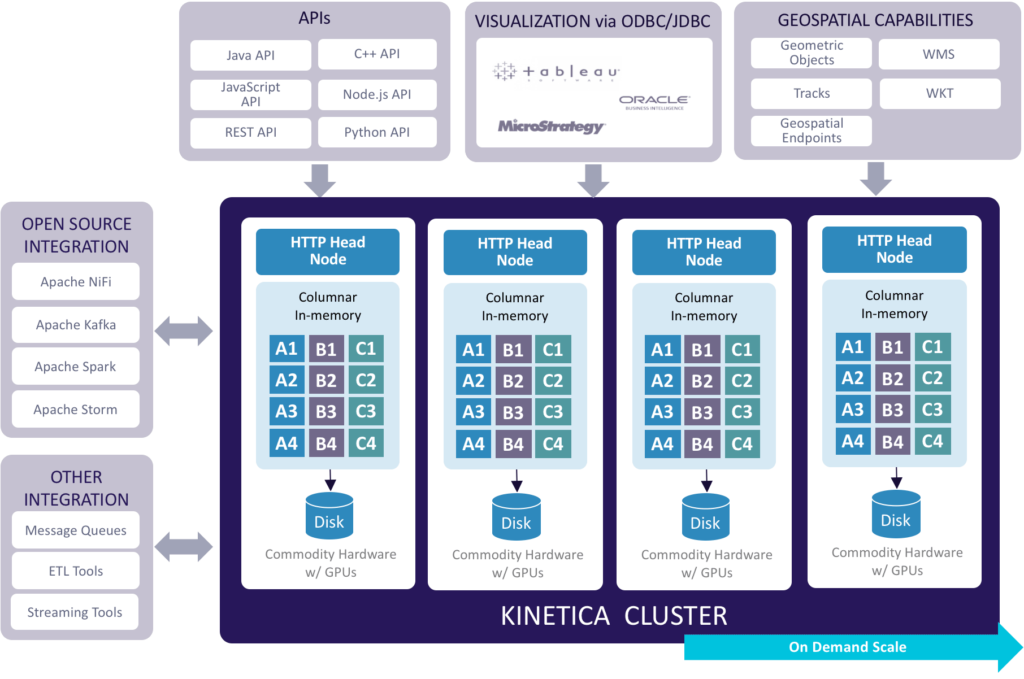
With the Kinetica architecture, you can have a cluster of Kinetica instances running and supporting multiple end points on one single host to directly ingest that data. The Kinetica architecture is:
- Reliable, Available and Scalable: The architecture offers disk-based persistence, data replication for high availability, and the ability to scale up and/or out.
- Performance: The GPU-accelerated architectures allows you to ingest billions of records per minute, and gain ultra low-latency performance from ingestion through to analytics.
- Connectors: You also benefit from Kinetica’s JDBC/ODBC capabilities, restful endpoints, open source APIs and native geospatial capabilities, so you can query the data sets based on the event sizes, etc., or look at the data sets from a spatial context as well. From a cyber IOT Network Analytics standpoint, that’s a very common use case.
Reference Architecture
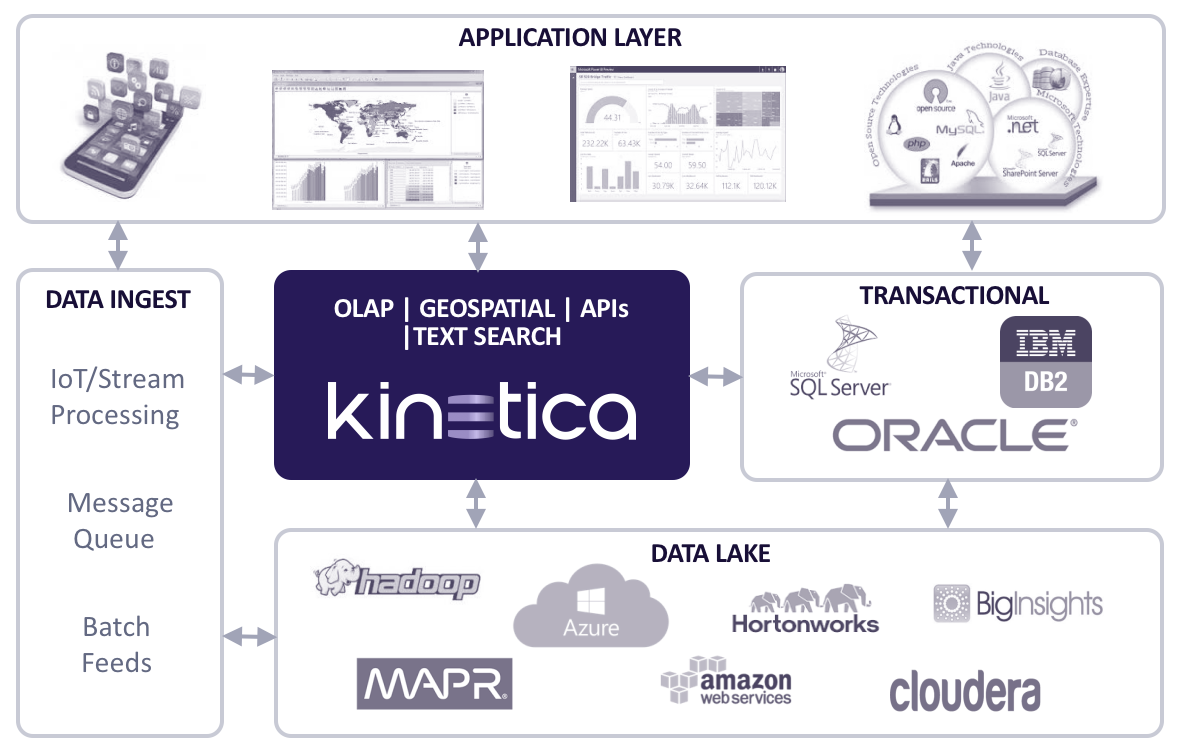
Kinetica can easily integrate with your existing data architecture by providing you with:
- A high-speed, in-memory database for your most critical, freshest data
- Real-time analytics for streaming data
- Accelerated performance of your existing analytics tools and apps
- The ability to offload expensive relational databases
- The ability to gain greater value from your Hadoop investment
Kinetica Demo with Flight Data and Twitter Data
In Amit’s Strata talk, he shows how Kinetica’s GPU accelerated geospatial visualization can be used to query on 310 million flight positions, using data from the FAA.
You can click on a random location to get access real-time flight positions. If you zoom in to see the data, the map re-renders itself on-the-fly—nothing is cached or indexed. You can change the color scheme and blur radius on-the-fly. Traditionally, with geospatial technology you have to index this data. By using GPUs, you can enable brute force computation at the time of query, which gives you dynamic results on-the-fly.
So for example, you could look at all flights tagged with ORD, which filters down from 310 million positions to 6.9 million flight positions. In the demo, notice that the heat map automatically re-renders. You can add an arbitrary timeline filter and get down to 1.6 million positions. As you can see from the flight demo, we’re ideal for fast moving, location-based IOT use cases such as supply chain management or logistics.
Amit also goes on to show how Kinetica can visualize 3.8 billion live Tweets (2:57 in). By clicking on a location, you can see live updates on what people are Tweeting about right now. You can zoom into a location and click on a random area to see the various Tweets. You can also do a freehand polygon search that displays all Tweets within a given area, or apply a timeline filter as well as free text search for a certain keyword. You can also do a search like “Show me everyone who’s Tweeting within one mile of any of my 5,000 retail locations.” So procedurally, you can use geospatial filters as an additional slice/dice mechanism.
Summary
In summary, Kinetica offers streaming ingestion and real-time processing of your data with a very simplified yet powerful architecture. Kinetica offers one single platform to ingest, store, and process all of your data, making it an invaluable tool for developers, DevOps, and analytics users alike.
Making Sense of Sensor Data