GPU Computing Is Revolutionizing Real-Time Analytics For Retail, CPG, Logistics and Supply Chain
Kinetica’s recent webinar with NVIDIA discussed using GPUs to efficiently and quickly ingest, explore, and visualize streaming datasets in new commercial use cases. Mark Brooks, Principal Systems Engineer, and NVIDIA’s John Barco, Senior Director of Partner Solutions, detailed these use cases in their webinar. Their presentation is below.
t
Kinetica was designed to be able to meet the needs of U.S. Army Intelligence Programs, and it was originally developed as a database with a pretty extreme set of requirements intended to assess national security threats. At the time that the U.S. Intelligence organizations were evaluating database technologies, they went through all of the existing standard relational systems (Hadoop, NoSQL), and there was just nothing that could scale. The requirements involved 250 high-velocity data feeds, and they needed to do analytics in real-time across those feeds.
Our company founders, who were consulting for the government at the time, had backgrounds in both geo-temporal capabilities and using GPUs, which were just starting to be recognized as a general-purpose compute device, and ideal for building a database. The product was born in that context. A patent was granted to the founders for the concurrency design that really exploited the GPU. That work won one of the first IDC HPC Innovation Excellence Awards.
Around the same time, the U.S. Postal Service (USPS) was looking for a database to start collecting breadcrumb information from all of their carriers, mail delivery vehicles, and postal workers. They were bringing the data in, but they could not do analytics on that data in real time. One of the first commercial implementations of the database that Kinetica had developed was with the USPS. This work with the USPS won a second HPC Innovation Award.
Evolution of Data Processing
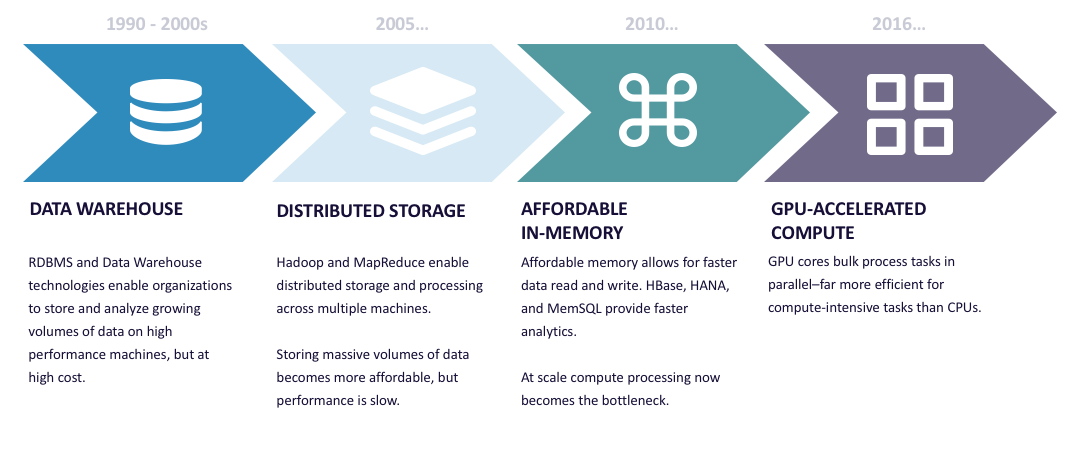
So where does a GPU database fit in the evolution of data processing? The patterns of large-scale data warehousing were well-established in the 1990s. In the early 2000s, with the advent of the Internet, petabyte scale requirements and scale-out storage came in. Storing massive volumes of data became more affordable, but performance was slow.
As memory became cheaper and much more available, the prospect of doing large-scale in-memory processing also became available, with products like SAP’s HANA and MemSQL entering the market. At this point, one could observe that networks were ubiquitously fast. Storage was fast, available and deep, with flash storage and four-terabyte drives. In terms of memory, it wasn’t unusual to have 512 gigs or a terabyte of RAM in a machine, so at the point where those limits are removed, traditional existing databases were compute-bound.
This is, in one sense, like the fourth wall. Once the other constraints are removed, what is it that forces traditional systems, even in memory systems, to have very, very wide horizontal scale and bloat? It’s because they’re adding machines to bring sufficient compute into the mix to meet SLAs on lots of data. This is where the next step is. Kinetica’s product was designed from the beginning to exploit the massive compute capability provided by GPUs, so these are very compute-dense devices. The Kinetica database uses simple flat data structures to feed the GPUs as efficiently as possible. It’s a database designed from the ground up to parallelize as much as possible to really use all of that intense compute capability by the GPU.
GPU Acceleration Overcomes Processing Bottlenecks
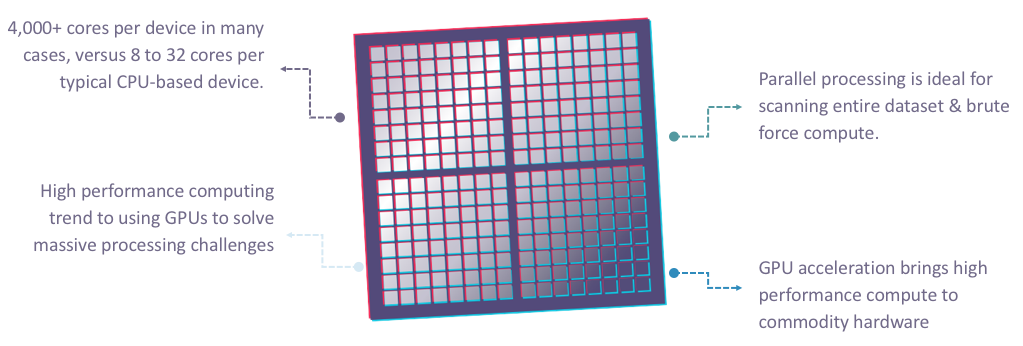
Let’s talk a little bit about the GPU and the history and why it’s so relevant today. About 20 years ago, NVIDIA produced the first GPU chip, and it was really designed initially for the 3D visualization market and gaming. The key point is that the construct for that processor was designed to do really large tasks in parallel. Compare that with the CPU, which is designed to really do stuff to manage commands sequentially. If you look at the GPU architecture, it is really different in the way that you build these chips. The chips themselves have thousands of cores of processing. For example, the latest Pascal chip that we’re shipping has over 3,000 cores on a single chip, compared to a CPU, which has roughly 8 to 32 cores per CPU.
What’s unique about a GPU is that it can handle thousands of threads simultaneously. That’s an order of magnitude larger than what a CPU can do. They’re also more cost efficient and power efficient. In fact, NVIDIA was named a leader in the Green500 Supercomputing List, as the most efficient, most energy-efficient supercompute solution. If you look at all that together, a GPU-based system can accelerate processing by over 100X on many different types of workloads, and that includes workloads like analytics and visualization. What’s really interesting is when you compare GPU and CPU performance over time.
In 2007, NVIDIA opened up the GPU chip to general compute functions, so the enterprise could run basic workloads, whether they’re a visualization, analytics, or AI workload. That changed the equation for the data center. Basically, what companies historically thought when they were compute-bound was that they would just add more x86 servers. The old Moore’s law, which stated that performance doubled every 18 months, just doesn’t hold anymore, and so today that P100 chip basically has about five times the amount of processing power as the leading CPU.
When you look at GPU plus CPU, you basically have a new blueprint for the data center. It’s that you take existing CPU-based systems that are driving legacy applications, and then you add GPUs for the high-performance workloads. It’s really a best of both worlds where you can use both GPU and CPU together to divvy up the workload.
Data and Analytics Use Cases
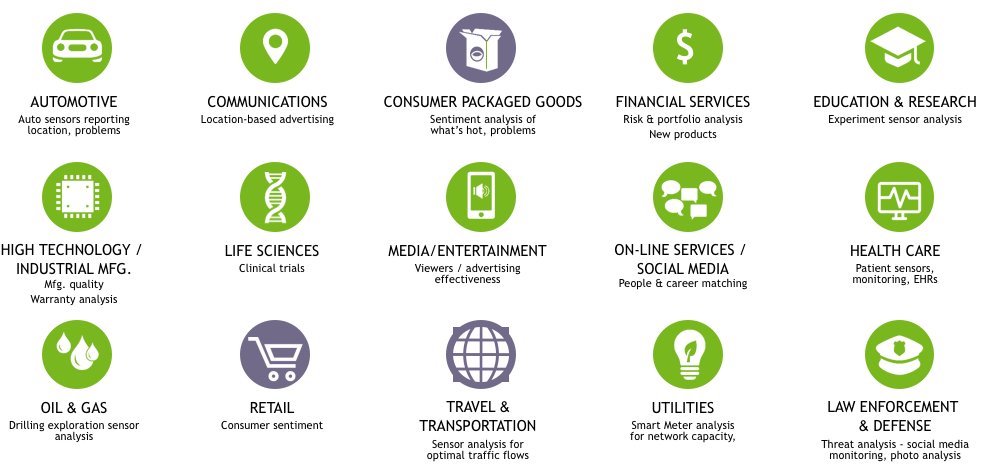
If you look at use cases for GPUs and for accelerated analytics, you can see that they apply to every industry. There are use cases across the board, and the reason is that all of these industries are compute-bound, and they’re data-driven. As every organization tries to become digital, data is how they’re driving their business. However, if you can’t compute and use the data that you’re actually collecting, then you really can’t move to that next level as an organization. Using GPU-based systems really is the only way to get fast data. What you typically see are workarounds. People will use cut-down data, or they’ll use sample data, but you can’t really find the outliers that you really need to find if you’re using that approach. GPU-based systems are really the only way to enable the insight into the data. There are a number of really interesting use cases across the board, and today, we’re going to focus on retail, CPG and transportation.
Real Time Fleet Optimization
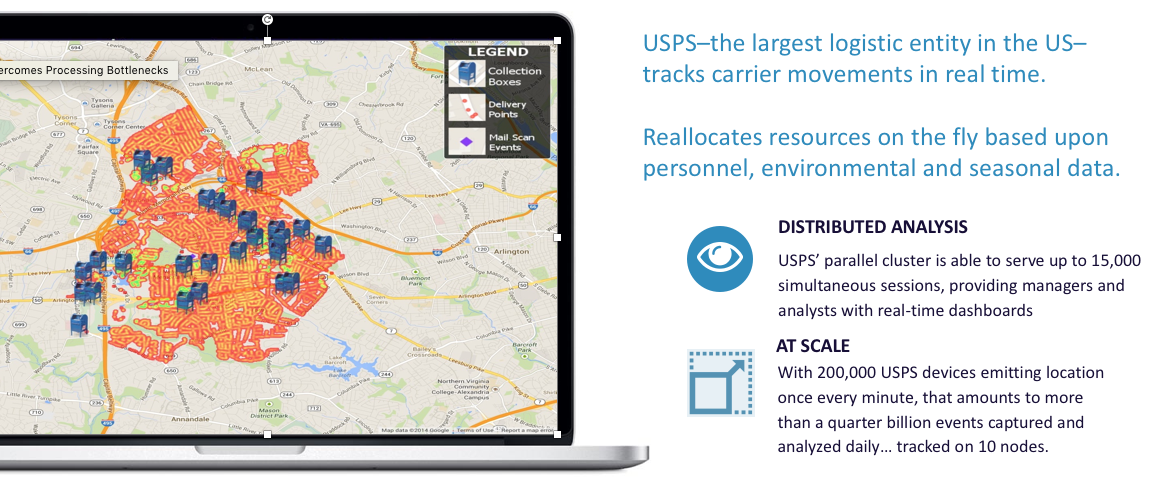
The U.S. Postal Service is the largest logistics entity in the U.S. Route optimization could save them millions of gallons of gas, for example, on trucks. When carriers call in sick, for example, they can re-allocate resources on the fly with respect to personnel, environmental, and seasonal variation. The implementation that we’ve had running for a couple years now in production at the USPS has about 15,000 simultaneous daily sessions, and managers and analysts are able to use real-time dashboards driven by breadcrumb and sensor data about where delivery vehicles and carriers are on their routes. There are 200,000 devices that are emitting location, once per minute, more than a quarter-billion events per day. One of the themes of this presentation is that you can get orders of magnitude increase in scale, without that hardware sprawl. Postal Service is a great example of that. They visualize billions of events, but the visualizations are not pulled from the database over the network and not rendered in a BI tool. Since we’re using GPUs for compute, we also use them to generate these visualizations, both 2D, 3D, still, and videos, at the database itself. The GPU brings a wealth of capabilities that can be exploited in the database.
Enabling New Enterprise Solutions
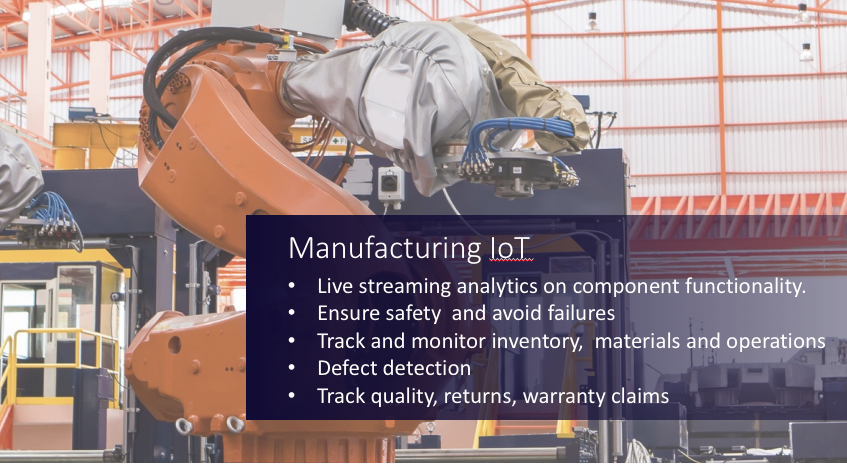
The poster child here for IoT is the scale of the sensors. In manufacturing in particular, where you have live streaming analytics from components, from assembly lines, from supply chains, from the actual machines themselves, as well as tags on the items being produced—this requires orders of magnitude more compute to be able to keep up with the ingestion of the events as well as the analytics. The use cases involved in this are optimization of the entire manufacturing chain, safety issues, avoiding failures, tracking inventory, materials, and operations, defect detection, quality, returns, and even warranty claims. There’s obviously just a huge range of use cases in manufacturing IoT.
Retail Solutions
One of the world’s largest retailers had a classic customer 360 use case, which meant consolidating all the information you know about your customer, including sentiment analysis from social systems, buying behavior, web, online, as well as in store, and then correlating that data with weather, point-of-sale systems, and wearable devices in order to build the most accurate view of your customer. The business analysts were able to go from queries that took hours, then minutes, then seconds, and then sub-seconds as they implemented Kinetica.
Another use case in retail has been supply chain optimization. We’ve had clothing retailers where the spike in demand of a particular product is so intense and happens so quickly that they’ve been caught short, and they’ve had out-of-stock situations. They want to be able to build systems that can react as quickly as possible to a variety of data feeds so they can make really up-to-the-minute routing and inventory decisions. Where should stock be replenished? Increasingly, these external data feeds about customer behavior sentiment coming from new sources is driving inventory management supply chain decisions.
Looking at the potential for GPU Databases in Retail. There’s no question that there’s money being spent, given the trillions of dollars that consumers have in their pocket. The real question is, given the trends that are going on is, how do you influence or inform people on where to shop, how to shop and buy? changed. All of those behaviors from a consumer perspective have changed. There’s an interesting stat from McKinsey. They had a report that just came out that said of the top 15 CPG players, only 5 are also among the top sellers on Amazon. So the way that people are buying product and the way that their behavior is being influenced has changed radically.
Retail & CPG Trends
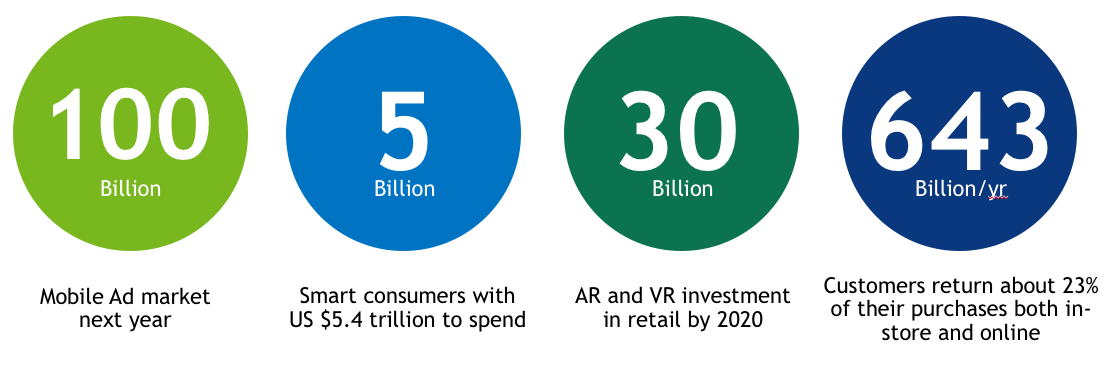
One of the interesting statistics in the chart says “$30 billion in AR and VR investment in retail by 2020.” AR is augmented reality, and VR is virtual reality. That $30 billion is essentially zero today, and so they’re saying that over the next three to four years, there’s going to be a huge amount of investment in that area which will change and influence the way that consumers buy, and the way that you build relationships with those consumers.
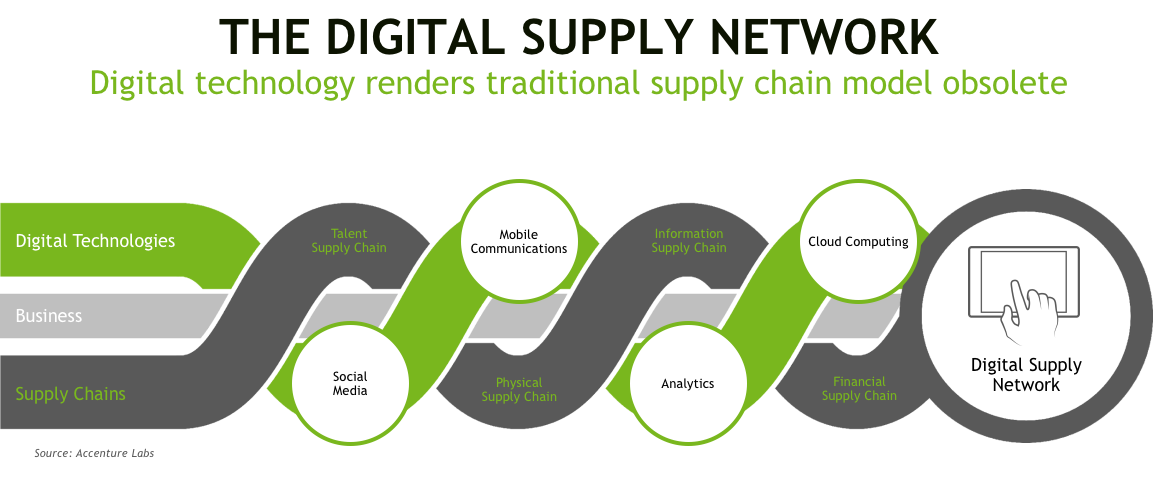
If you look at the role for GPU databases in logistics and what’s happening with that today, basically Accenture has labeled this the digital supply network. With the external disruptive influencers around social media and mobile, analytics, and cloud, the traditional supply chain models are essentially obsolete. The big mantra that you’ll hear from everyone today is that the currency of the future is now speed. What we believe is that the more you can make data fast, actionable, and intelligent, both from data at rest and data in motion, the more likelihood you’ll be able to build a long-term relationship with a customer. Again, we think that this is really transforming the way that you get insight, and that insight from data is really the key. That’s the foundation.
The classic challenges to implementing fast and scalable data systems today is the existing data infrastructure, so the legacy systems that are the current workhorses are just not designed to handle the volume and variety of data. These systems are just not designed to handle thousands of simultaneous requests, and certainly not with a sub-second response time. It comes down to the hardware that underlies it, how many threads it has available, how many requests it can actually handle.
There are also well-known data integration challenges with multiple data silos. For example, one keeps inventory system data separate from social media feeds. You build a modern news system or there’s a cloud component where your social media data is, and you’ve got legacy systems on-prem, and you manage these multiple data silos from a data integration perspective. That’s the well-known complexity of connections, brittle data integrations, and processes.
The architecture designed a decade ago in many cases is not aligned with the requirements of doing fast analytics on very large amounts of data. You have existing systems, so the question is, how you can efficiently move to take advantage of GPU-powered database analytics?
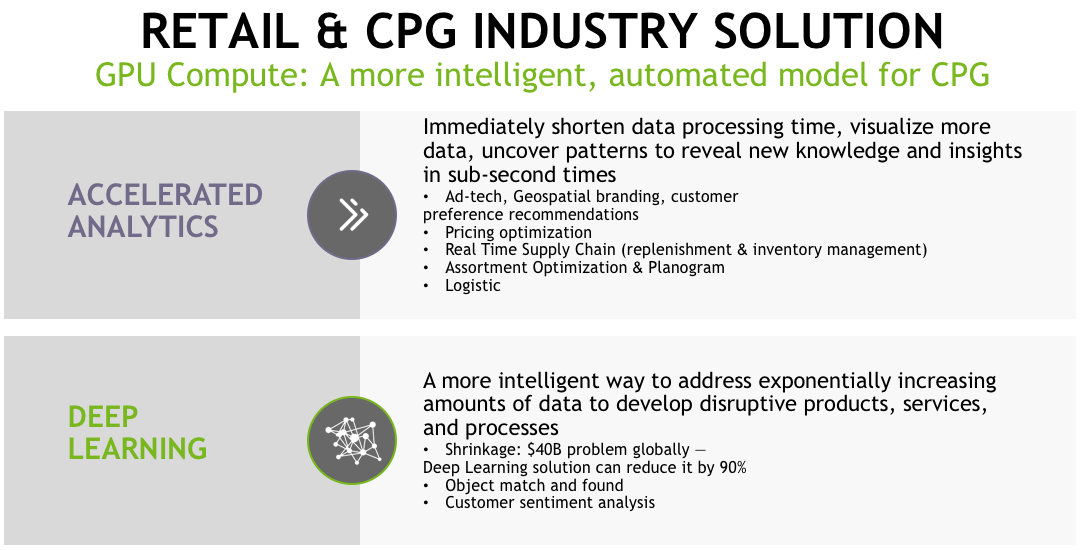
There are really two parts to the solution of bringing GPU compute into this context. The first one is really about how to achieve accelerated analytics. If you put Kinetica’s database, which is an in-memory distributed GPU-powered database, into this environment with the challenges from the previous slide, you can immediately shorten the data processing time. You can visualize much more data. You can uncover patterns in sub-second times.
The use cases for GPU accelerated analytics has been quickly adopted in ad tech. Use cases include pricing optimization, real-time supply chain use cases for doing replenishments and looking at out-of-stock situations, how to do inventory management, assortment optimization, and planograms. What mix of product should be delivered and for sale when and where? Any type of logistics, so again, there’s many places where having this quality of accelerated analytics can be brought to bear.
Machine learning and Deep Learning are other opportunities for GPU databases. The interesting thing is that accelerated analytics and deep learning are really aligned together. For deep learning, you basically use the insight and the patterns that come from the accelerated analytics to basically build models and feed data into your deep-learning frameworks. For retail and CPG, there’s a number of different areas that deep learning is being investigated and used in. The big one is around theft and shrinkage. It’s a huge problem today, and a number of customers think that by using deep learning with object matching that they’ll be able to reduce that by up to 90%. It’s also used in a number of different areas, such as predictive sentiment analysis. How do they think customers are going to buy or want to buy and when, where, of what type of product? It’s a natural tie-in to accelerated analytics, and we think there’s going to be a lot more use of deep learning as the time goes on.
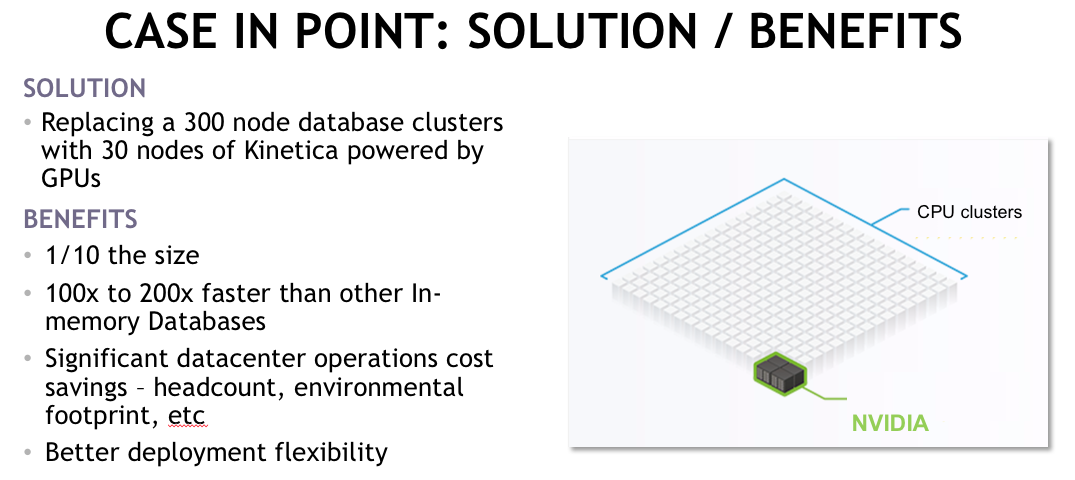
With a major retailer, we had the opportunity to address some of their challenges. This was in the context of a retailer who had huge capital investments in what they believed were state-of-the-art data management systems. They still were not meeting their SLAs with their out-of-stock use cases described earlier. They wanted to correlate weather, social media demand, and avoid out-of-stock situations to drive the bottom line. A Kinetica cluster powered by GPUs, which was one-tenth the size, proved out on their top-10 hardest queries that they gave us, which were real traditional BI queries: star schema, and fact tables of 150 billion rows joined to multiple dimension tables in a classic distributed join doing GROUP BYs.
In this context for the analytics, it was traditional SQL of GROUP BYs, aggregations, selects, and joins. This came out on one-tenth the hardware, 100 times faster. As we continued to optimize, it got beyond that, and so this is not true just against the one particular vendor we were going up against, but it’s true for other in-memory databases.
As previously noted, bringing large memory into the database world is a good thing because it cuts down your latency in getting to data, it reveals that the bottleneck in the systems now is the ability to have enough compute resource to process the data. Compared to other in-memory databases, they are so compute-bound that we were able to demonstrate a significant performance gain on a small footprint.
Things like GROUP BYs on very high cardinality datasets are a characteristic of the new types of analytics: how many different product SKUs are there? How many different customer IDs are there? For very large-scale apps to do aggregations on highly cardinal datasets, you can’t index your way out of it. You really need to have the massive parallel compute available. Running on such a small hardware footprint, the ROI was calculated based on the significantly reduced data center operations cost and the integration flexibility.
Kinetica: The Fastest, Distributed, In-Memory Database
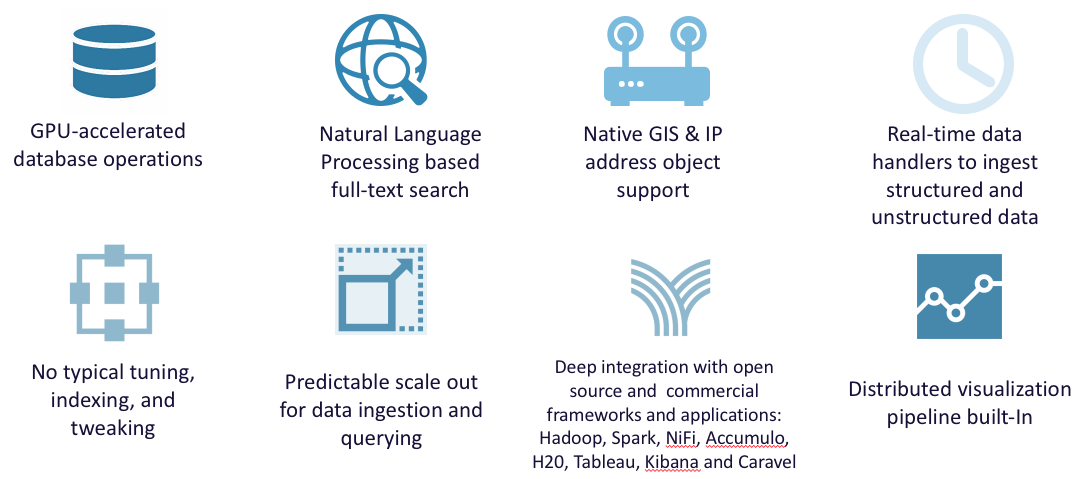
With Kinetica, the three main characteristics are that it’s GPU accelerated, it’s distributed–you can cluster it, it scales out horizontally–and it is in-memory. We leverage the GPUs to do a natural language processing, full-text search, so you don’t need a separate system to build a search index. We have native geospatial support and IP address support, so if you’re using this in anomaly detection in a cybersecurity context, you can have native IP addresses.
Kinetica also provides real-time data handlers. With the previous retailing use case, they came to us and said, “We need you to do 300 million events a minute.” We did four billion events per minute on ingestion, so we have very strong real-time data handlers – massively parallel ingestion across the cluster. With Kinetica, with so much compute and with data in memory, a table scan is not a bad thing. We store data in a columnar format in-memory in small chunks and feed it in parallel to the thousands of cores in the GPUs. Recently, I was on an eight-node cluster that had two NVIDIA GPUs each, and it had 8,000 cores per node, so 64,000 GPU cores were working on data in memory. There’s no need to create indexes or partitions or do any particular tuning there. It’s a beast on the compute side.
The scale-out then is predictable. You want to cut your SLA in half? Just scale horizontally. You need to hit a particular data ingestion, messages per second? Then just do linear scale-out. There’s deep integration with all of the Hadoop-friendly open-source frameworks: MapReduce, Spark, NiFi, Accumulo, HBase as well as with H2O, Tableau, Kibana, Caravel. ODBC and JDBC drivers are exposed and a distributive visualization pipeline is built in. The retail customer referenced earlier labeled this as a next-generation converged data infrastructure because there was so much just in the single Kinetica install. On a techie note, it just takes a single RPM and a single config file to get this cluster up and running, so there’s a massive amount of functionality without the layer cake of configs required on other systems.
Redesign Retail without Redesigning your Data
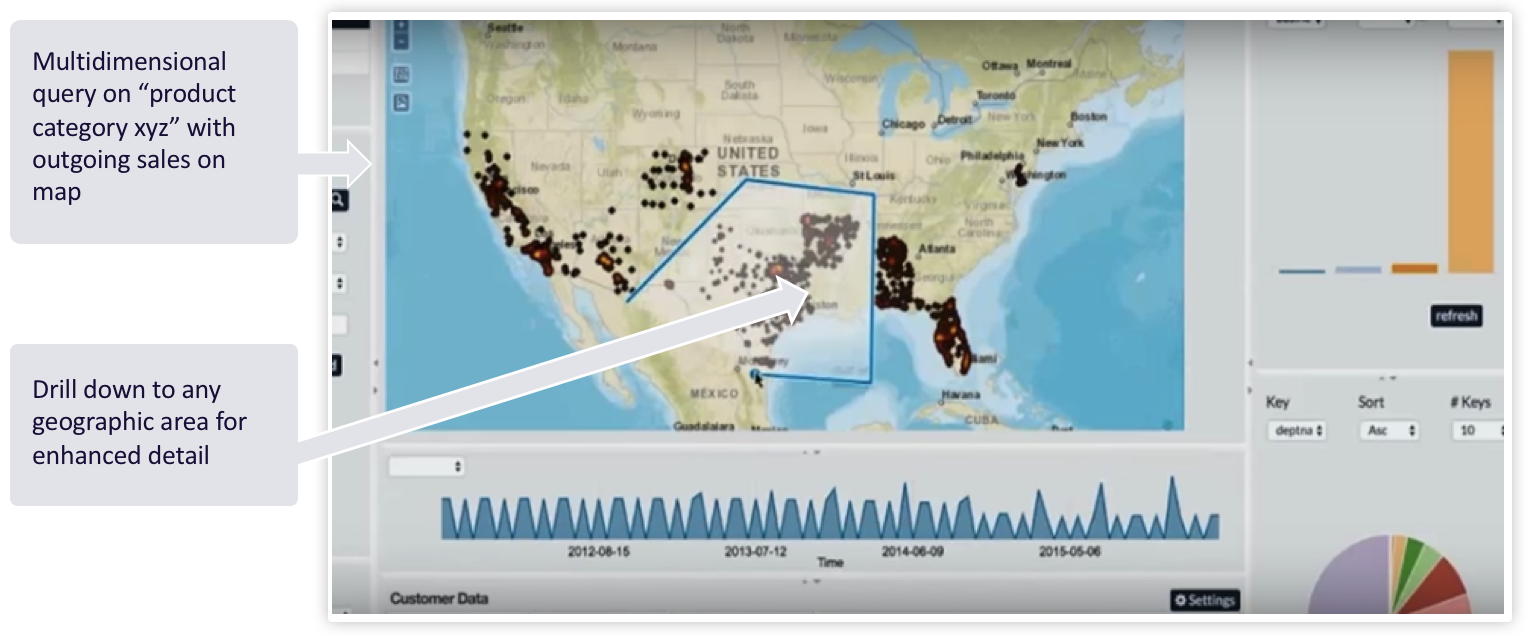
Visualization comes from Kinetica. This is a light-weight web application that’s calling the Kinetica APIs to render visualizations that you can drill down to at any level of detail, and just get deeper and deeper into the data, down to the street level. If you want a multi-dimensional query on, a product category based on a region, you can simply draw a region, and we’ll perform in sub-second, even on billion-row datasets, what’s contained within that region. Then you can just drill down on it. You can interact with the histogram control at the bottom just to select the time dimension and stack these filters up. You can really slice and dice your data without having to redesign it. I did not need to massively de-normalize the data to get this to work. You’ve got this compute and analytic capability without having to change your data model.
Kinetica Architecture
The Kinetica cluster, which is depicted in the middle of this diagram, scales out horizontally as needed. Data is sharded as necessary, like for a fact table across the cluster. There’s persistence, so you do get a resiliency guarantee as data is inserted across the cluster. On the left, for integration capabilities, we have all of the standard open-source, Hadoop-friendly connectivity options, so we can talk to Kafka, Spark, Storm, and NiFi. You can hook this up to ETL tools and messaging queues.
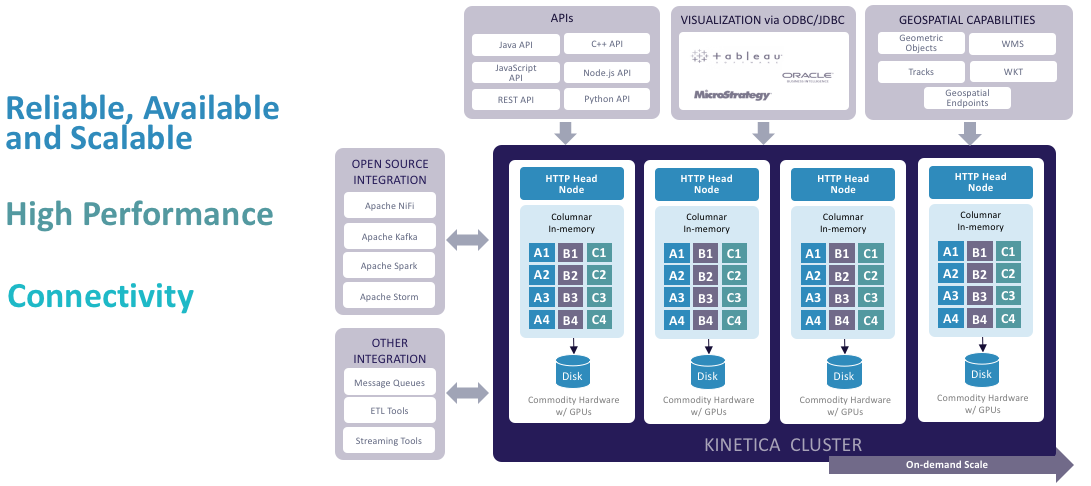
For the consumption side, then, there are a number of APIs on the product. It has a built-in REST API from which then we auto-generate Java, Python, Node.js, JavaScript, and C++ language binding, so you can write a web app directly against the database. You can talk to it with a Python notebook. You can write Java code. There are ODBC and JDBC drivers exposed for BI integration. Custom geospatial work can be done, as well as integration.
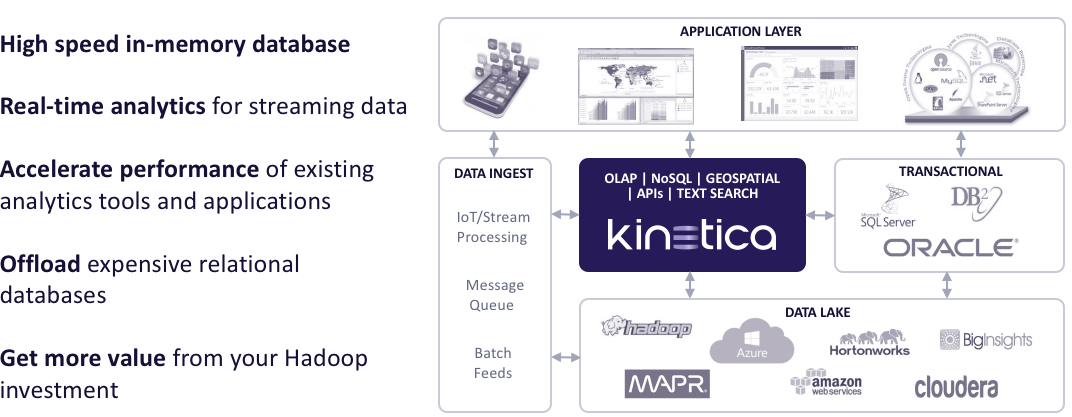
In terms of where it fits in the reference architecture, typically we’re dropped into the high-speed in-memory database for the most important streaming data in the environment, so it’s the Ferrari for the most valuable data that your analysts are hungry to get their hands on quickly. When we are dropped in the mix here, we can then accelerate the performance of existing tools and applications. We can offload the pressure that’s placed on either Hadoop or relational systems. We let them continue to do their jobs. For example, the value of having a Hadoop-based data lake is a good thing and our high-speed in-memory database is a great complement to that environment.
Streaming Analytics Simplified
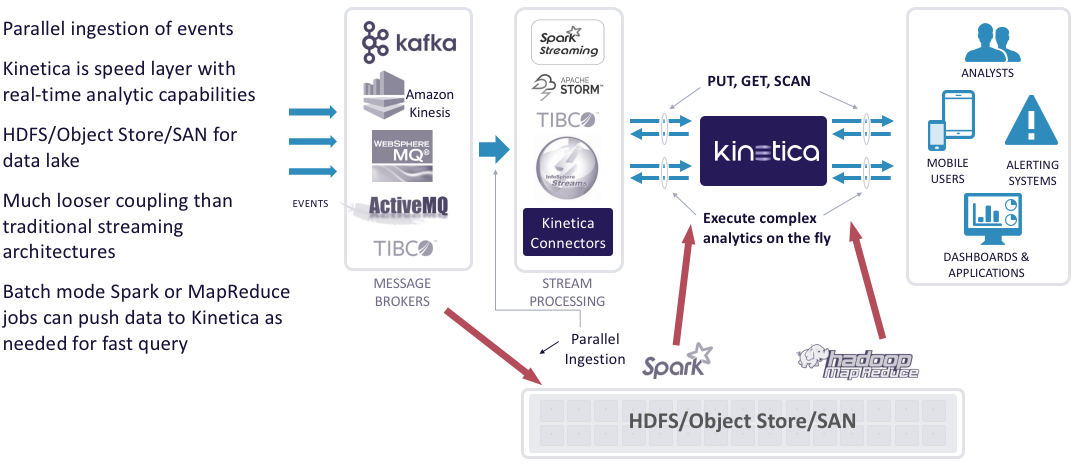
Quite commonly, we are dropped into environments that have Hadoop or some other type of data lake. In the cloud, for example, we may see the data lake where all data lands for permanent archival and batch analytics might be on Amazon S3, Azure storage, or Google. If you want to do streaming analytics in that environment, the Lambda architecture, or more recently the Kappa architecture often involves dual ingestion. As events come in, you process them, and you also write them out to the data lake. You may use Kafka or Kinesis or message buses to handle events that come in.
Without having such a capable analytic database in the speed layer, where Kinetica is depicted in the diagram here, the traditional way of implementing a Lambda architecture would be with NoSQL, like HBase or Cassandra. Let’s say the question is, “Is it more than one standard deviation greater in transaction size than the historical average of that particular customer?” To satisfy a streaming analytic question like that in a Lambda architecture, one could stage batch analytic jobs that you run on a schedule from the data lake, and then you serve them up and make them available to the speed layer. This is the classic Lambda architecture.
To implement it, it involves standing up a NoSQL, having batch analytics run, and pushing the batch analytics up into memory cache so that they can be available. There are a lot of moving parts. The hidden cost is the operational complexity of trying to do that. How do you upgrade? Everything’s very tightly coupled, very complex, with all of the horizontal scaling, so seeing a 1,000-plus-node cluster is not unusual to try to do streaming analytics with a data lake in that context.
With a small-footprint Kinetica cluster on the speed layer, the Kinetica cluster is fast enough to honor the semantics of the NoSQL, but is also fast enough to execute complex analytics on the fly and is deep enough that it can hold many years of transaction history on the fly as well. You wind up with a much simpler and decoupled architecture. You can still use it in batch mode if you like, but it greatly simplifies and increases the capability of your streaming architecture.
Performance vs. Other In-Memory Database
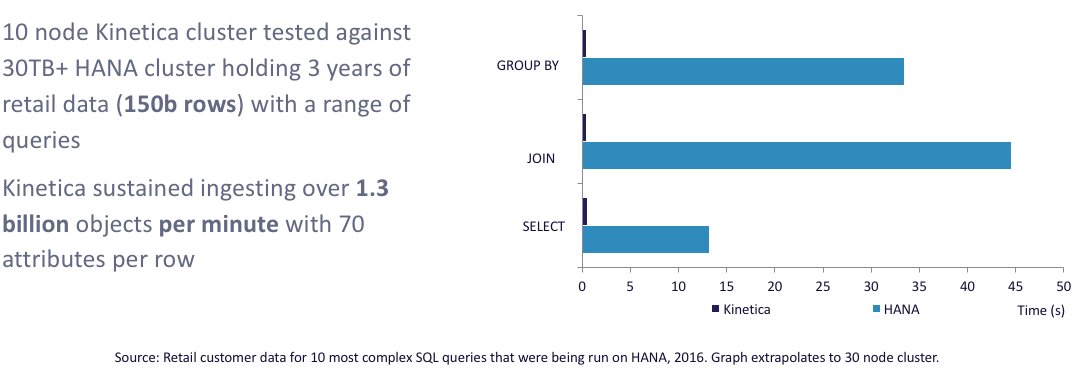
This is the performance graph versus a competitor from the retail use case that I described earlier on 150 billion rows, so there are very impressive numbers there.
Availability
Kinetica runs on NVIDIA hardware, and it runs on industry standard HP, Dell, IBM, and Cisco hardware. You can get it in the cloud from Amazon, and Azure and Google are coming online as we speak.
Kinetica and NVIDIA for Accelerated Analytics
Together, with Kinetica software running on NVIDIA GPU hardware, you have unmatched performance, with orders of magnitude better performance on a much smaller hardware footprint, with billions of data points handled in sub-seconds. The NVLink is what really makes it possible to speed the movement of data across and into the GPUs; we’ve seen 5X greater performance there. The scalability is much more efficient using these compute-dense nodes. You get much greater scale but on a fraction of the hardware. And it plugs in everywhere with standard APIs and integration components.
Making Sense of Sensor Data